
RNA SEQ Data Analysis
This course provides a comprehensive understanding of RNA SEQ DATA ANALYSIS and equips students with the necessary skills to analyze RNA SEQ experiments. It combines theoretical knowledge with practical applications, preparing students to contribute to the rapidly evolving field of genomics and Data analysis


Educator
UJJAWAL SOLANKI

Difficulty
Intermediate

Mode
Live

Language
English
About Course
This course provides a comprehensive understanding of RNA SEQ DATA ANALYSIS and equips students with the necessary skills to analyze RNA SEQ experiments. It combines theoretical knowledge with practical applications, preparing students to contribute to the rapidly evolving field of genomics and Data analysis
RNA SEQ Data Analysis
Day 01
Introduction to RNA-seq & Experimental Design
- What is RNA sequencing?
- Bulk RNA-seq vs single-cell RNA-seq
- RNA-seq experimental workflow
- Biological vs technical replicates
- Experimental groups and controls
- Sequencing technologies
- FASTQ file structure
- Phred quality score
- Single-end vs paired-end sequencing
- Stranded vs unstranded libraries
Day 02
Obtaining RNA-seq Data & Linux Fundamentals
- NCBI SRA and GEO
- SRA accession types: SRR, SRP, SRS, PRJNA
- Reference genome and annotation
- Metadata and sample information
- Search SRA
- Download data using SRA Toolkit
- Convert SRA → FASTQ
- Understand paired-end files
- Linux commands:
Day 03
Quality Control of Raw Reads
- Why quality control is important
- Per-base sequence quality
- GC content
- Sequence duplication
- Adapter contamination
- Overrepresented sequences
- Run FastQC
- Analyze FastQC reports
- Run MultiQC
- Compare multiple samples
- Identify potential sequencing problems
Day 04
Read Trimming & Post-trimming QC
- Adapter contamination
- Low-quality bases
- Quality trimming vs adapter trimming
- Why aggressive trimming can be harmful
- Use Fastp
- Perform adapter removal
- Quality filtering
- Generate Fastp reports
- Run FastQC again
- Compare pre- and post-trimming quality
Day 05
Reference Genome & RNA-seq Alignment
- Genome reference
- GTF/GFF annotation
- Transcript vs gene
- Mapping reads to genome
- Splice-aware alignment
- HISAT2 vs STAR
- Alignment metrics
- Download/reference genome preparation
- Build or use HISAT2 index
- Align reads
- Generate SAM/BAM
- Understand alignment statistics
Day 06
BAM Processing & Alignment QC
- SAM vs BAM
- BAM sorting
- BAM indexing
- Mapping rate
- Properly paired reads
- Multi-mapped reads
Using Samtools:
SAM → BAM → Sort → Index → Statistics
- samtools view
- samtools sort
- samtools index
- samtools flagstat
samtools stats
Day 07
Gene-level Quantification
- Gene expression quantification
- Read counting
- Exon-level vs gene-level counting
- FeatureCounts
- Count matrix
- TPM, FPKM and raw counts
- Why DESeq2 requires raw counts
- Run featureCounts
- Generate gene count matrix
- Understand annotation/GTF
- Remove unwanted annotation columns
- Construct sample metadata
Day 08
Introduction to R & RNA-seq Count Matrix
- Why R is widely used for RNA-seq
- R objects
- Data frames
- Matrices
- Factors
- Metadata
- Count matrix structure
- Import count matrix
- Import metadata
- Check sample names
- Match metadata with expression data
- Remove unwanted columns
- Filter low-count genes
Day 09
Exploratory Data Analysis & Normalization
- Why normalization is required
- Library size
- Size factors
- Variance stabilization
- PCA
- Sample clustering
- Batch effects
- Create DESeqDataSet
- Estimate size factors
- Normalize counts
- VST/rlog
- PCA plot
- Sample correlation
- Hierarchical clustering
- Heatmap
Day 10
Differential Gene Expression Analysis
- Null hypothesis
- Fold change
- Log2 fold change
- p-value
- Multiple testing
- FDR / adjusted p-value
- Biological vs statistical significance
- DESeq2 methodology
- Run DESeq2
- Define experimental contrast
- Extract results
- Apply thresholds, e.g.:
padj < 0.05
|log2FC| ≥ 1
- Identify:
- Upregulated genes
- Downregulated genes
- Significant genes
Day 11
DEG Visualization
- Volcano plots
- MA plots
- Heatmaps
- Expression patterns
- Why visualization matters
- MA plot
- Volcano plot
- DEG heatmap
- Top 20/50 DEG heatmap
- Upregulated/downregulated gene plots
Tools : ggplot2 + ComplexHeatmap/pheatmap
Day 12
Functional Enrichment Analysis
- Gene Ontology
- Biological Process
- Molecular Function
- Cellular Component
- KEGG pathway
- Over-representation analysis
- Background gene set
- GO enrichment
- KEGG enrichment
- Upregulated DEG enrichment
- Downregulated DEG enrichment
Generate:
- Dot plot
- Bar plot
- Enrichment plot
- Gene-concept network
Day 13
Advanced Biological Interpretation
- GSEA vs ORA
- Why GSEA can detect subtle changes
- Ranked gene lists
- Pathway-level interpretation
- Gene set enrichment
- GSEA
- Hallmark pathway analysis
- GO-GSEA
- KEGG-GSEA
- Enrichment plots
Day 14
Complete RNA-seq Pipeline & Reproducibility
- Reproducible bioinformatics
- Conda environments
- Version control
- Workflow management
- Pipeline automation
- Nextflow introduction
- Directory organization
Day 15
Complete Mini Project & Report Writing
- How to interpret RNA-seq results
- How to write an RNA-seq analysis report
- Figure legends
- Results vs Discussion
- Common RNA-seq mistakes
- Biological validation
- Limitations of computational analysis

Educator – Ujjawal Solanki
Ujjawal is a Bioinformatics professional with a robust foundation in multi-omics and computational biology. Holding a Master’s in Biotechnology, he excels in microbiome analysis and has contributed to diverse projects in phylogenomics, network biology, and transcriptomics. With a strong research background and a passion for blending theoretical knowledge with practical applications, Ujjawal is dedicated to inspiring students in genomics, microbiome research, and data-driven biological discoveries. He is committed to advancing bioinformatics education and promoting a deeper understanding of computational methods across various life sciences domains.
Students Reviews
https://www.youtube.com/watch?v=ctNAjuxyyEk?feature=sharehttps://www.youtube.com/watch?v=VJrsM3LGmrM?feature=share

Shriraksha.H.Padaki
very nice

Animesh Ray
I hve learnt some basic about bioinformatics..

SUBHAM DAS
Help to acessing new bioinformatics tool.

Prabhavi Praveenkumar kamble
It help to aggregate my data more properly and to make me Express them is more statistically.
ANUSHA P V
It helped me a lot in gaining knowledge regarding the topic.
RNA SEQ DATA ANALYSIS COURSE
Mode – Online
Certificate Provided
Hours 15-20 Hours
Time 7:00 PM IST
Last Date 20 August 2026
Course Start 25 August 2026
Recorded lecture Provided after session
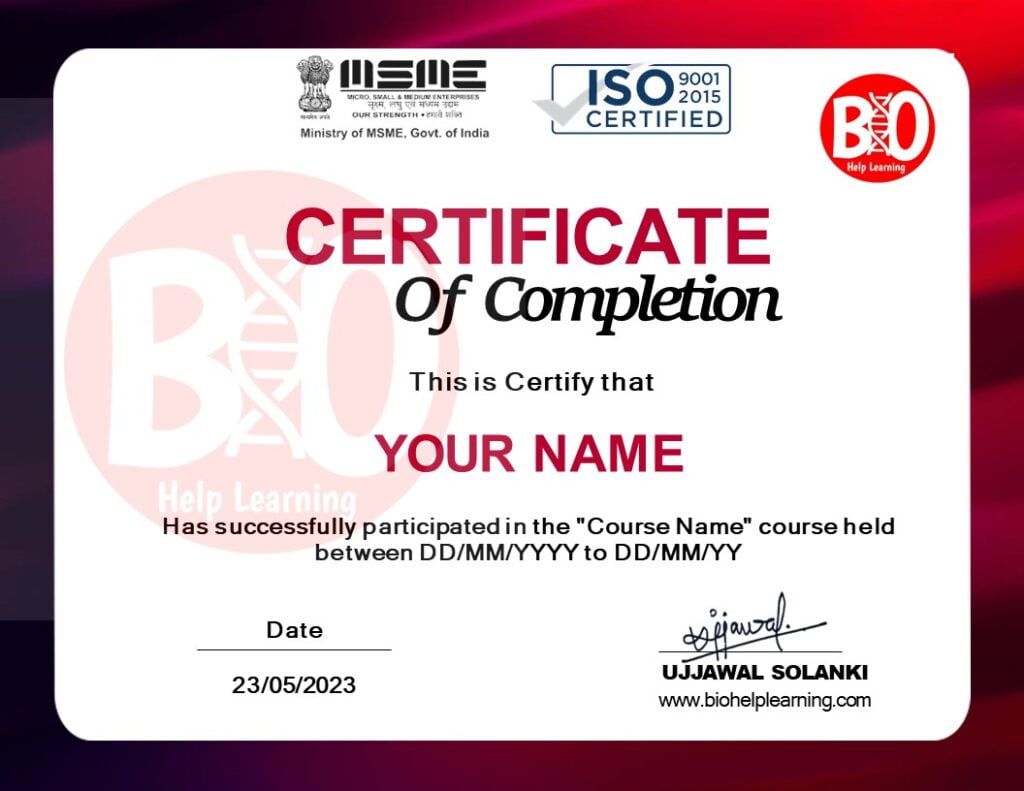
Certificate
FAQ
Session Joining link will be send to your register email on the day of session start you can join session by clicking joining link.
What if I missed live sessions? Will this be recorded?
Yes! All of our Live sessions are recorded and you can access recorded session after live classes, recorded session link will be send to your respective email after live classes. recorded session will be available for 30 days after live classes
All Session are evening sessions time of session is between 7:00 to 8:00 PM IST.
What about the refund of the course?
Please read refund policy in refund policy section page.
What Prerequisites knowledge required to join the course?
No, any short Prerequisites knowledge you required to join the course.