Your genome is the same in almost every cell of your body. Your proteins are not. A liver cell and a brain cell carry the same DNA but make very different sets of proteins, and those proteins change again when you eat, sleep, fall ill or take a medicine. Proteins do most of the actual work in a cell, and most drugs act on them. If you want to know what a cell is doing right now, you have to look at its proteins.
So what is proteomics, and how did bioinformatics change it? In simple words, proteomics is the large-scale study of all the proteins in a cell, tissue or organism: which ones are present, how much of each, how they are modified, and how they work together. Modern proteomics produces millions of mass spectra per study, and without software no human could turn those spectra into protein names.
In this article you will learn what proteomics is and how it differs from genomics, how the field moved from 2D gels to mass spectrometry, the specific ways bioinformatics altered every step of protein analysis (including AlphaFold), a real case where bioinformatics exposed a false discovery, what proteomics looks like in India, which skills and courses lead to a proteomics career, and what the field still cannot do.
What Is Proteomics? A Simple Definition
The word proteome is a blend of “protein” and “genome”. It was coined in 1994 by Marc Wilkins, then an Australian PhD student at Macquarie University, who presented the term at a conference in Siena, Italy, that September. Wilkins later explained that he simply got tired of typing “all proteins expressed by a genome, cell or tissue” and tried several words before settling on proteome. Proteomics is the study of the proteome.
One key idea separates proteomics from genomics. A genome is fixed: it is a sequence of DNA letters. A proteome is always changing. The set of proteins in a cell depends on the cell type, its age and its environment, so a proteome is really a snapshot of one moment. One gene can also produce several protein forms through alternative splicing and chemical changes after translation, such as phosphorylation or glycosylation. Each distinct form is called a proteoform.
Genomics vs proteomics: what is the difference?
Genomics reads the instruction manual. Proteomics watches the factory floor. Genomics can tell you that a person carries a gene variant. Proteomics can tell you whether the protein from that gene is actually being made, in which tissue, in what amount, and in what modified form. The two answer different questions, and the most powerful studies today combine them, an approach called proteogenomics. If you want the genomics side of this story, read our companion article what is genomics and how bioinformatics changed it.
Main branches of proteomics
- Expression proteomics: measuring which proteins are present and how their amounts change between conditions, for example healthy versus diseased tissue.
- Structural proteomics: working out the three-dimensional shapes of proteins and complexes.
- Functional and interaction proteomics: mapping which proteins bind to which, also called interactomics.
- PTM proteomics: studying post-translational modifications (PTMs), such as phosphoproteomics for phosphorylation.
- Clinical proteomics: finding protein biomarkers in blood, urine or tissue for diagnosis and treatment.
- Proteogenomics: combining DNA or RNA data with protein data, for example to find new protein-coding regions.
Every branch now depends heavily on computing. For the wider context, see our guides to what bioinformatics is and its branches and what computational biology is.
From 2D Gels to Mass Spectrometry
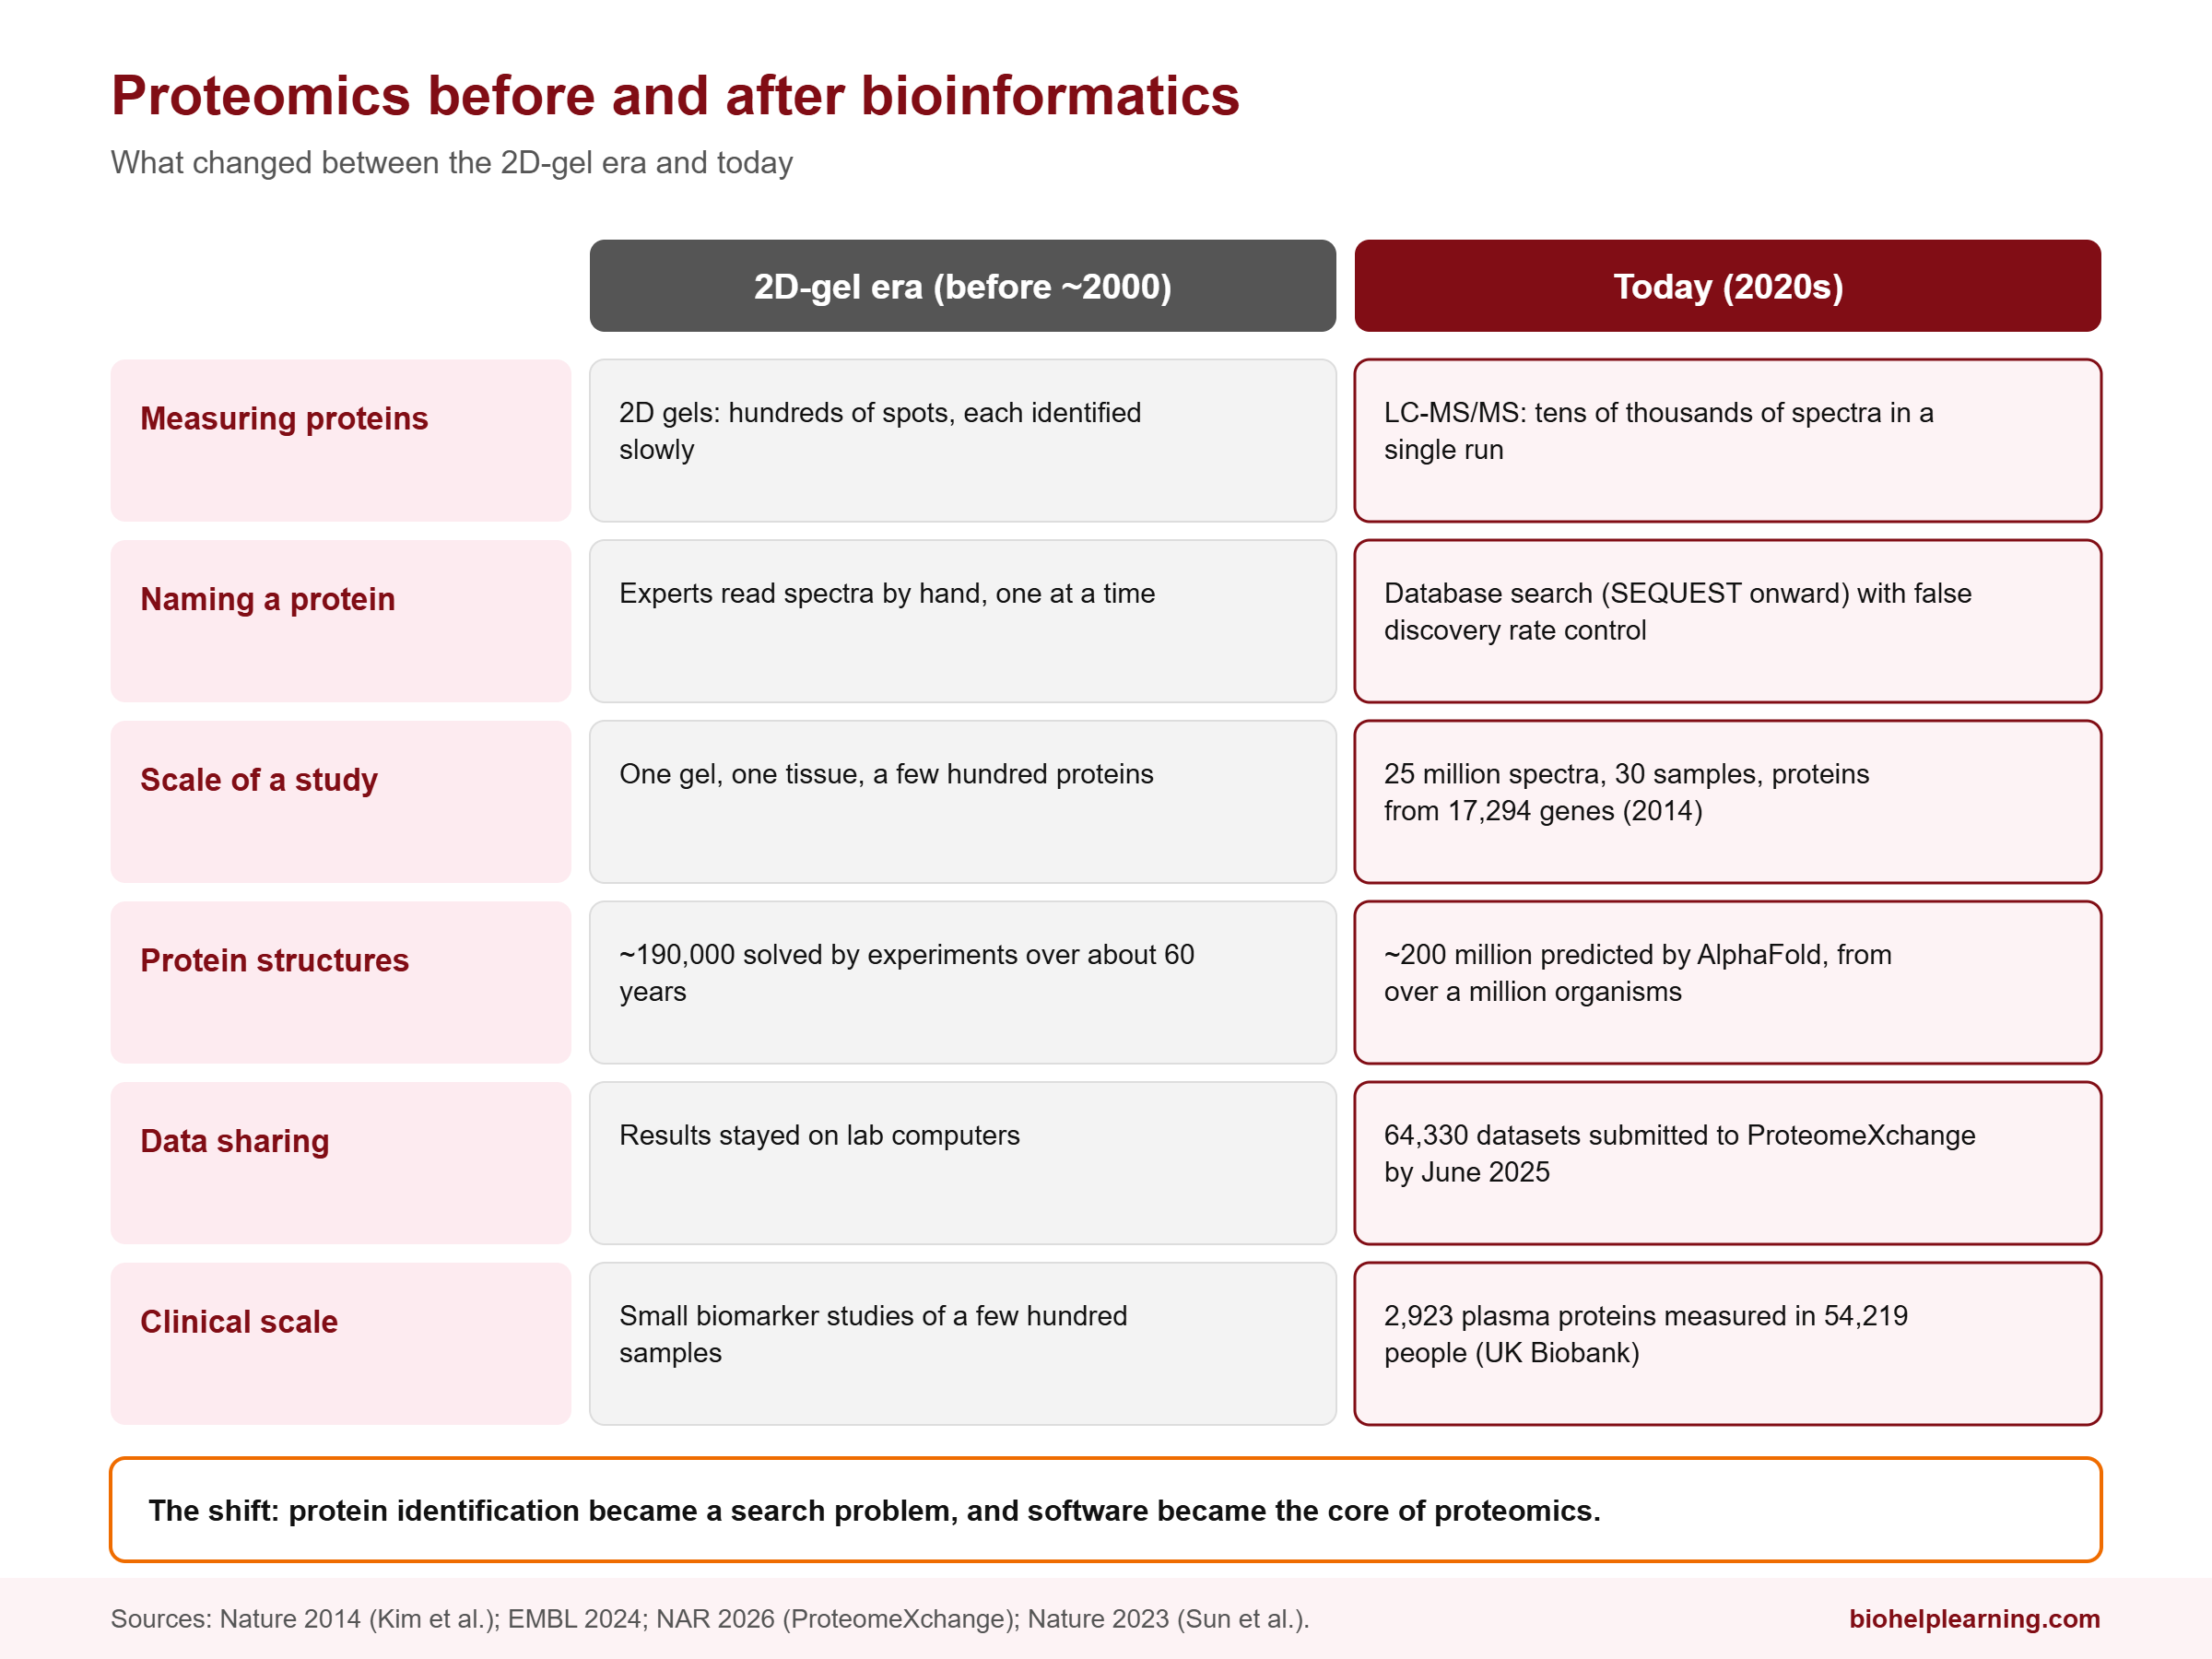
Early proteomics relied on two-dimensional gel electrophoresis, which separates proteins by charge in one direction and by size in the other. The result is a gel covered in hundreds of spots. It was the workhorse of the field for years, and the 1994 Siena meeting where the word proteome was born was itself a meeting about 2D gels. But a spot on a gel is not a protein name. Identifying each spot was slow.
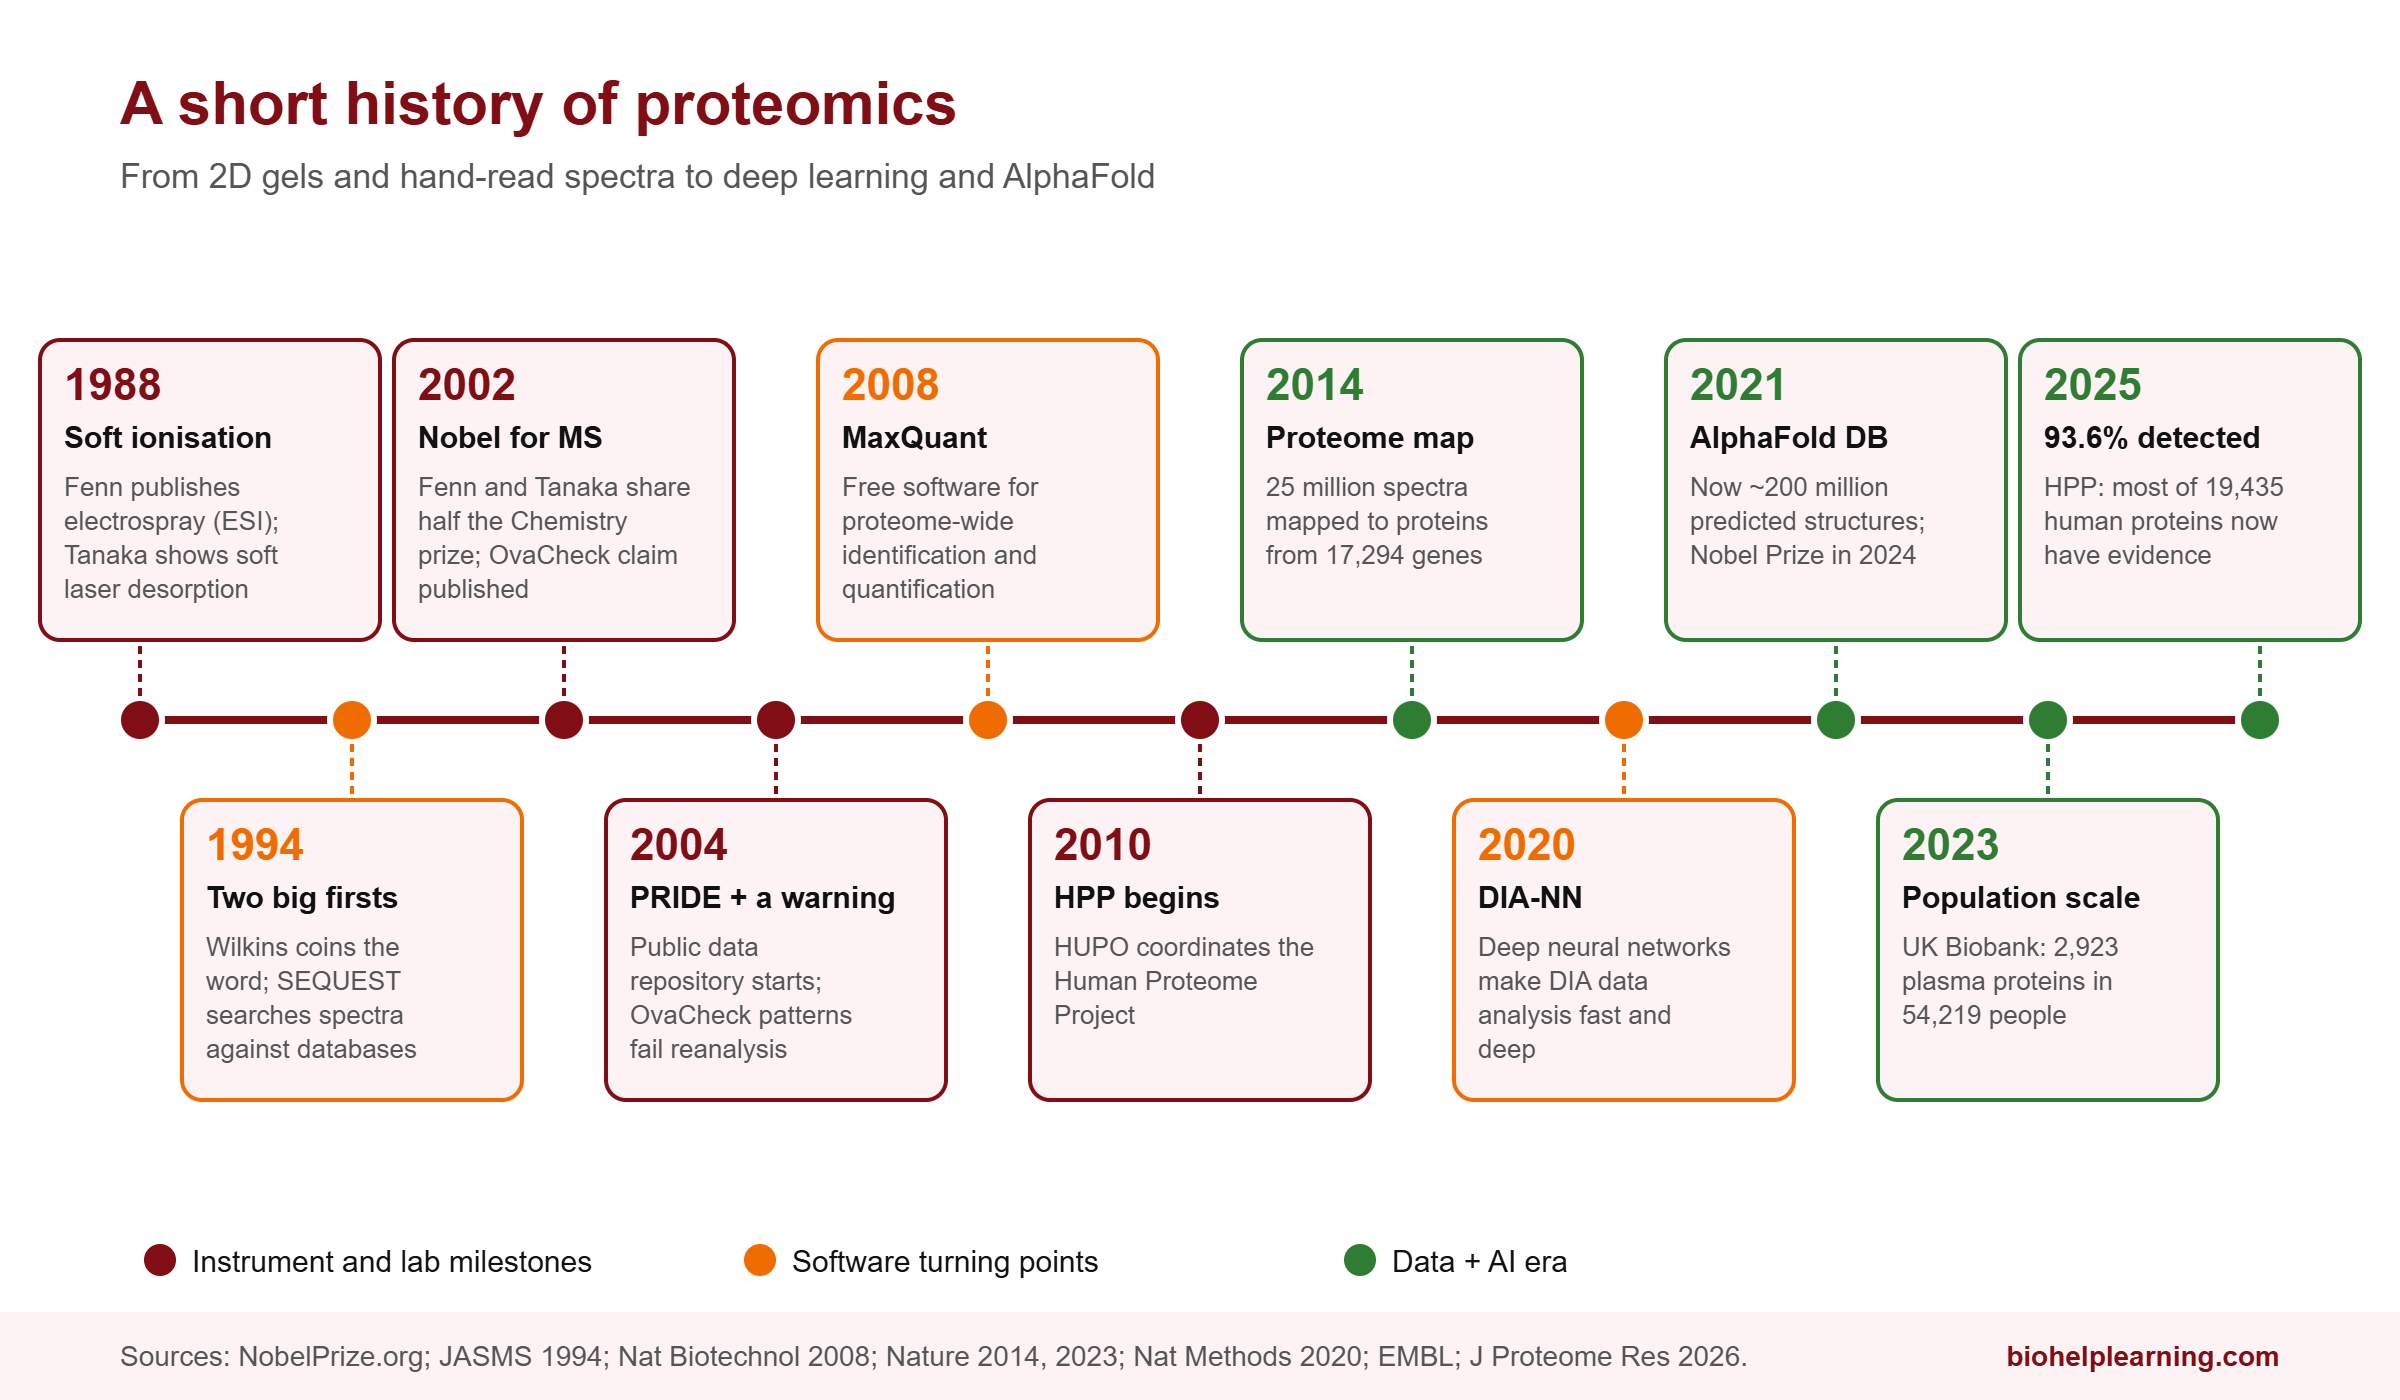
The game changed with mass spectrometry (MS), which measures the mass-to-charge ratio of molecules very precisely. For a long time, mass spectrometers could not handle large, fragile biological molecules. Two methods solved that problem. In 1988, John Fenn published electrospray ionisation (ESI), which sprays a protein solution into charged droplets that shrink until free protein ions remain. At the same time, Koichi Tanaka, an engineer at Shimadzu in Japan, showed that a laser could gently lift proteins into the gas phase. A closely related method, MALDI (matrix-assisted laser desorption/ionisation), developed by Franz Hillenkamp and Michael Karas in Germany, became a standard tool. Fenn and Tanaka shared half of the 2002 Nobel Prize in Chemistry for these “soft” ionisation methods. Tanaka never earned a doctorate.
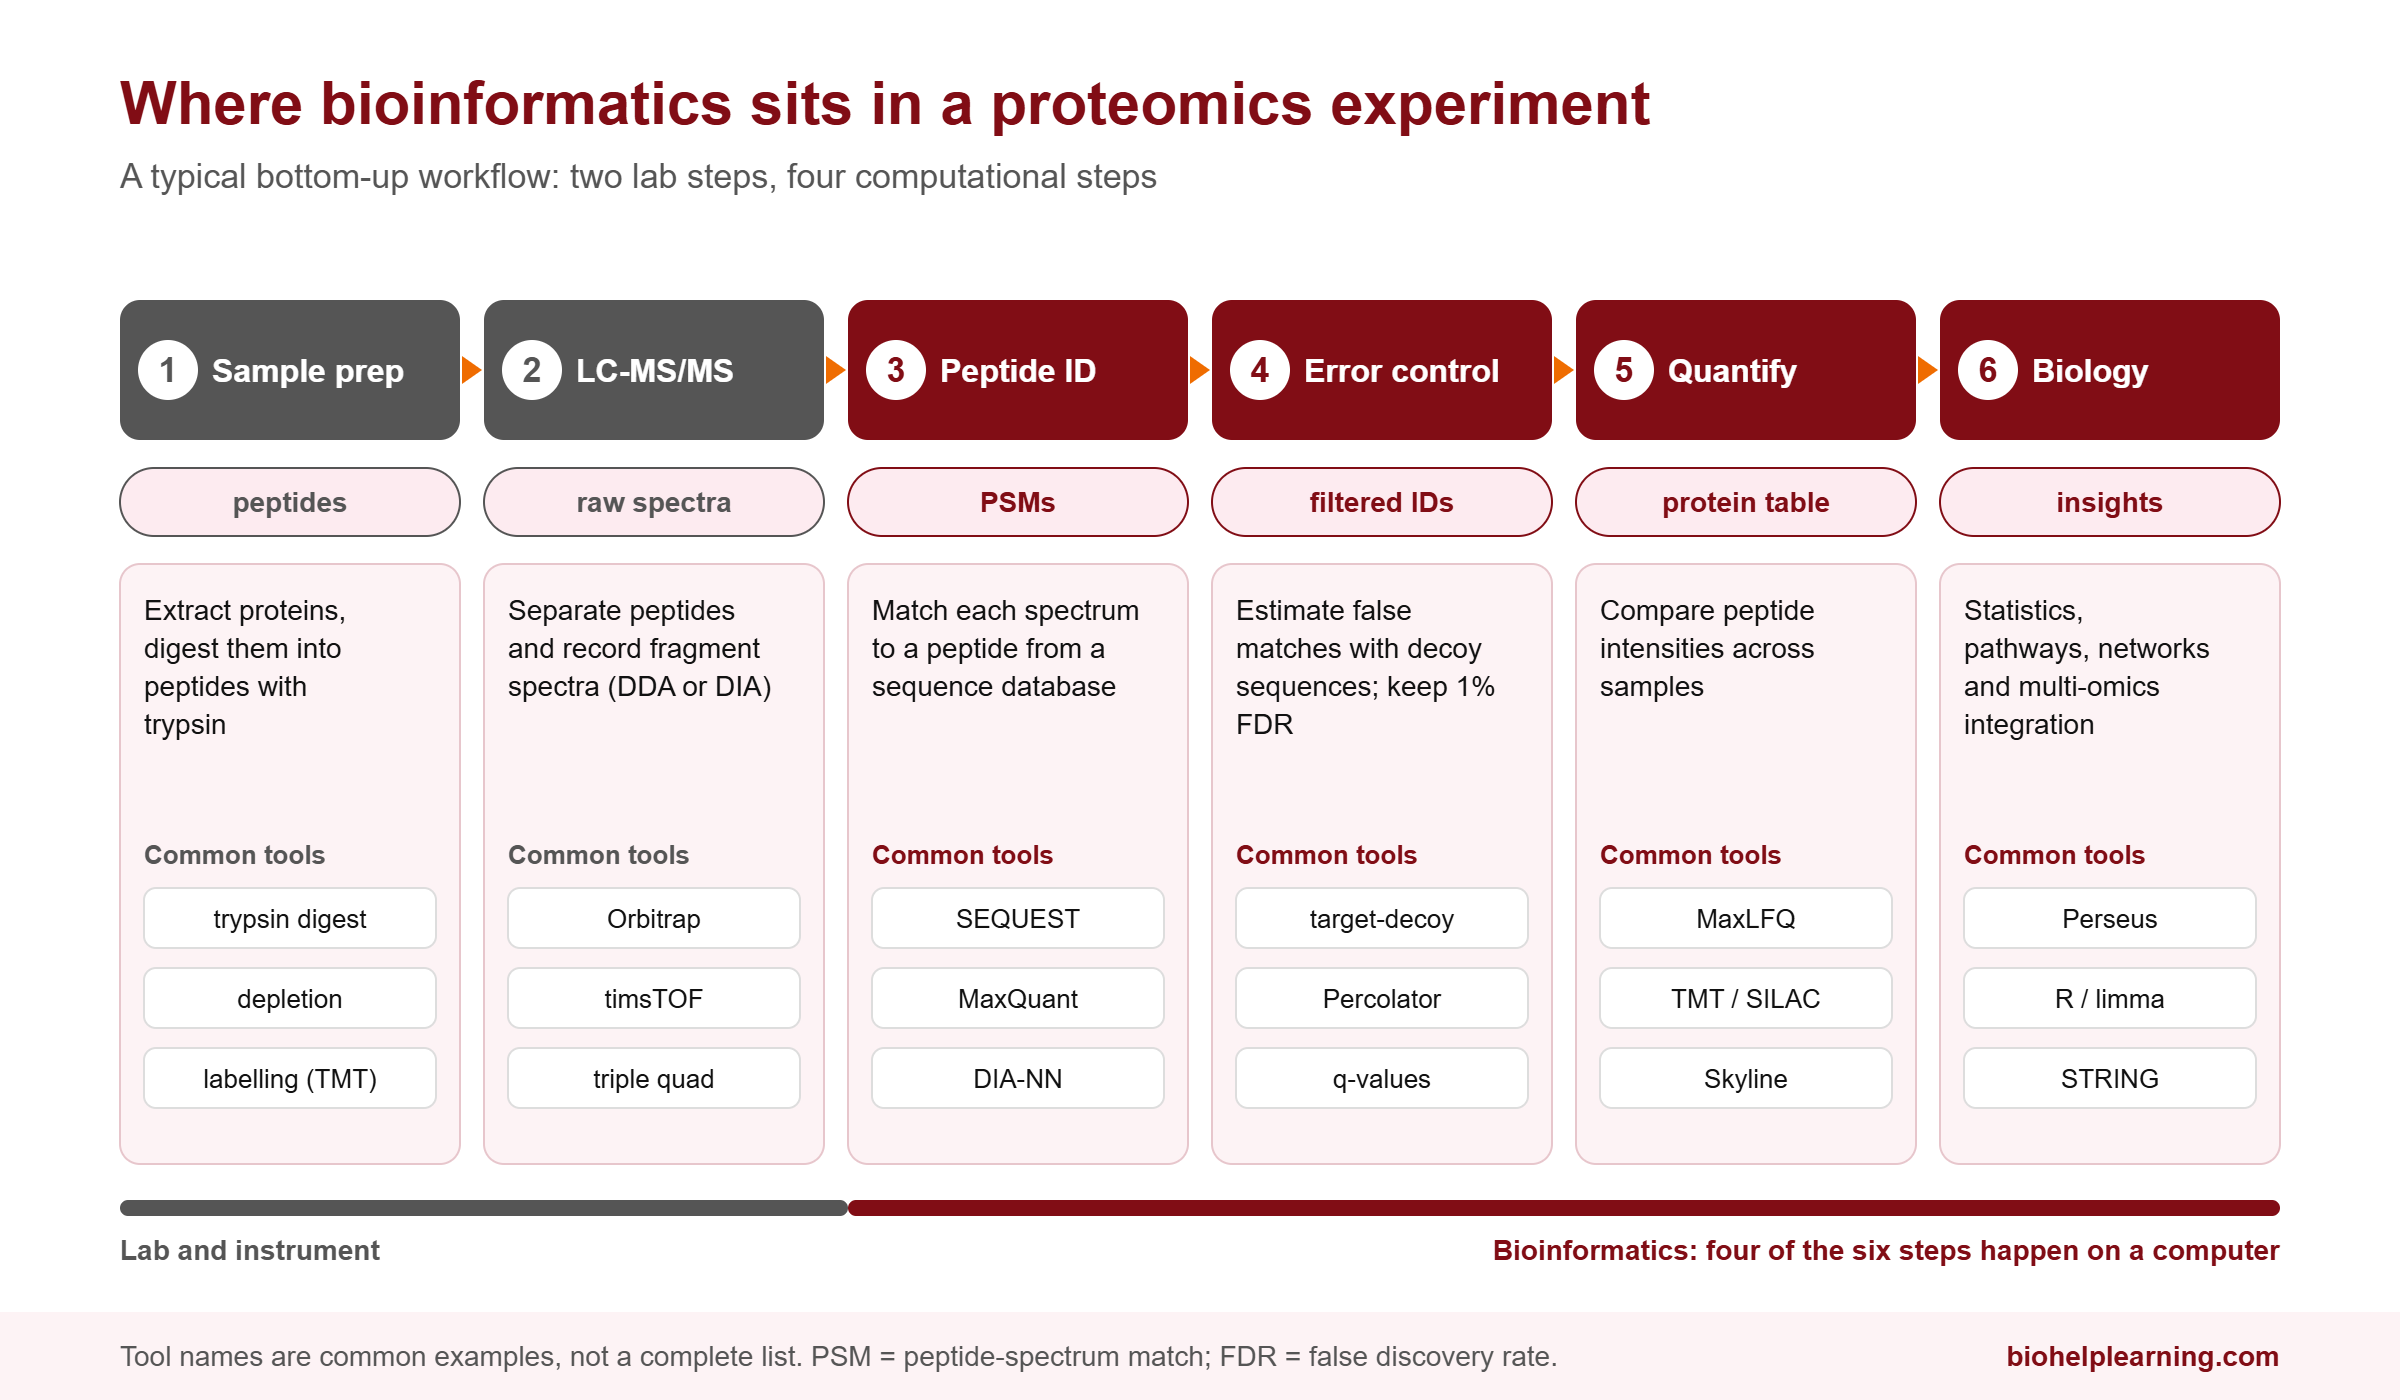
Today, the standard approach is called bottom-up or shotgun proteomics. Proteins are cut into short peptides with the enzyme trypsin, the peptides are separated by liquid chromatography, and a tandem mass spectrometer (LC-MS/MS) breaks each peptide into fragments and records their masses. Each fragmentation pattern is a spectrum. That is where bioinformatics enters.
If you need a refresher on how mass spectrometers work, our article on mass spectroscopy covers the basics.
The Turning Point: When Spectra Met Sequence Databases
A tandem mass spectrum does not come labelled with a peptide sequence. In the early days, experts interpreted spectra by hand, one at a time. A single modern LC-MS/MS run produces tens of thousands of spectra. Manual interpretation simply cannot keep up.
In 1994, Jimmy Eng, Ashley McCormack and John Yates at the University of Washington published a method that became the software SEQUEST, the first database search algorithm for tandem mass spectra. Yates had realised that genome sequencing projects were producing lists of predicted protein sequences. Instead of reading each spectrum from scratch, the software could take every possible peptide from a protein database, predict its fragmentation pattern, and score how well each prediction matched the real spectrum. The best match is called a peptide-spectrum match (PSM).
This one idea tied proteomics permanently to bioinformatics. Protein identification became a search problem: a computer comparing observed data against sequence databases, much like BLAST does for DNA. As genomes were sequenced, proteomics got better automatically, because the search space became more complete.
The scale this enabled is easy to see in the 2014 draft map of the human proteome, published in Nature by a team led by Akhilesh Pandey at Johns Hopkins, with many co-authors from the Institute of Bioinformatics in Bangalore. The team profiled 30 normal human samples, including 17 adult tissues, 7 fetal tissues and 6 types of blood cells. From more than 2,000 LC-MS/MS runs and 25 million spectra, software identified about 293,000 distinct peptides, which mapped to proteins from 17,294 genes, roughly 84% of human protein-coding genes at the time. No team could have read 25 million spectra by eye.
How Bioinformatics Altered the Field of Proteomics
Here are the specific ways computing reshaped each step of proteomics.
1. Identification: from manual reading to database search
SEQUEST was the start. Today many search engines exist, but they share the same core logic: generate theoretical spectra from a database, compare, score. Because millions of comparisons are made, some matches will be wrong by chance. Bioinformatics also supplied the statistical answer: estimate a false discovery rate (FDR), usually by also searching a “decoy” database of reversed or shuffled sequences and counting how often decoys win. Reporting results at a fixed FDR, commonly 1%, is now standard practice.
2. Quantification: measuring how much, not just what
Knowing that a protein is present is only half the question. Biologists want to know whether it went up or down. In 2008, Jürgen Cox and Matthias Mann published MaxQuant in Nature Biotechnology, a free software platform for high-accuracy identification and proteome-wide quantification. It and its later label-free quantification method (MaxLFQ) became among the most widely used tools in the field. Software handles the hard parts: aligning runs, correcting mass errors, and comparing peptide intensities across dozens of samples.
3. Data-independent acquisition and deep learning
Classic shotgun proteomics picks the most intense peptides to fragment, so it misses some peptides in some runs. A newer approach, data-independent acquisition (DIA), fragments everything in wide mass windows. The trade-off is that the spectra become very complex mixtures, and only clever software can untangle them.
In 2020, Vadim Demichev and colleagues published DIA-NN in Nature Methods. It uses deep neural networks to separate real peptide signals from noise, and it can work from spectral libraries predicted entirely by computer from a protein sequence database, so no prior experimental library is needed. Independent benchmarks have found DIA-NN and the commercial tool Spectronaut among the strongest DIA software options. It is a clear example of a measurement method and its software advancing together.
4. Structure: AlphaFold and the protein-folding problem
For decades, finding a protein’s 3D shape meant months or years of X-ray crystallography or cryo-electron microscopy. Over about 60 years, experimental methods solved roughly 190,000 protein structures.
AlphaFold 2, developed by Google DeepMind, changed that. When the AlphaFold Protein Structure Database launched in July 2021 with EMBL-EBI, it held just over 360,000 predicted structures, including all known human proteins. It has since grown to about 200 million predictions from more than a million organisms, covering almost every protein known to science. In 2024, Demis Hassabis and John Jumper shared half of the Nobel Prize in Chemistry for protein structure prediction. The other half went to David Baker for computational protein design. AlphaFold was trained on decades of structures that scientists had shared in public databases, which is a reminder that open data made the AI possible. We cover more on this in our article on AI in bioinformatics.
5. Open data at global scale
Proteomics data used to sit on lab hard drives. That changed with public repositories. PRIDE, started in 2004 at EMBL-EBI, is now the largest proteomics data repository in the world, receiving about 534 new datasets a month. Since 2012, PRIDE and other repositories have shared data through the ProteomeXchange consortium. By June 2025, 64,330 datasets had been submitted, 69% of them already public, and 1,156 new datasets arrived in that month alone. Public data lets anyone reanalyse old experiments with new algorithms, and it is the raw material for the next generation of machine learning models.
6. Population-scale proteomics
Proteomics is now starting to work at population scale, as genomics did before it. The UK Biobank Pharma Proteomics Project, a consortium of 13 pharmaceutical companies, measured blood plasma proteins in 54,219 UK Biobank participants using the antibody-based Olink Explore 3072 platform, which captures 2,923 unique proteins. Linking those protein levels with participants’ DNA, the team found 14,287 primary genetic associations with protein levels, called protein quantitative trait loci (pQTLs), and 81% had not been described before. The results were published in Nature in October 2023. Analyses of this size are entirely computational: the lab work produces numbers, but the discoveries come from statistics on hundreds of millions of data points.
7. Completing the human protein parts list
The Human Proteome Project (HPP), coordinated by the Human Proteome Organization (HUPO) since 2010, aims to find credible evidence for at least one protein from every human protein-coding gene. Its 2025 report, published in the Journal of Proteome Research in early 2026, describes a reference proteome of 19,435 proteins, of which 93.6% have now been detected. The remaining 6% or so, the “missing proteins”, are proving hard to find because they are made in tiny amounts or only in rare tissues. Deciding what counts as credible evidence for each protein is itself a bioinformatics task, built on shared databases such as UniProtKB, PeptideAtlas and the Human Protein Atlas.
Case Study: When Bioinformatics Exposed a False Discovery
Bioinformatics does not only make discoveries. It also catches mistakes. The story of OvaCheck is one of the most important lessons in proteomics, and every student should know it.
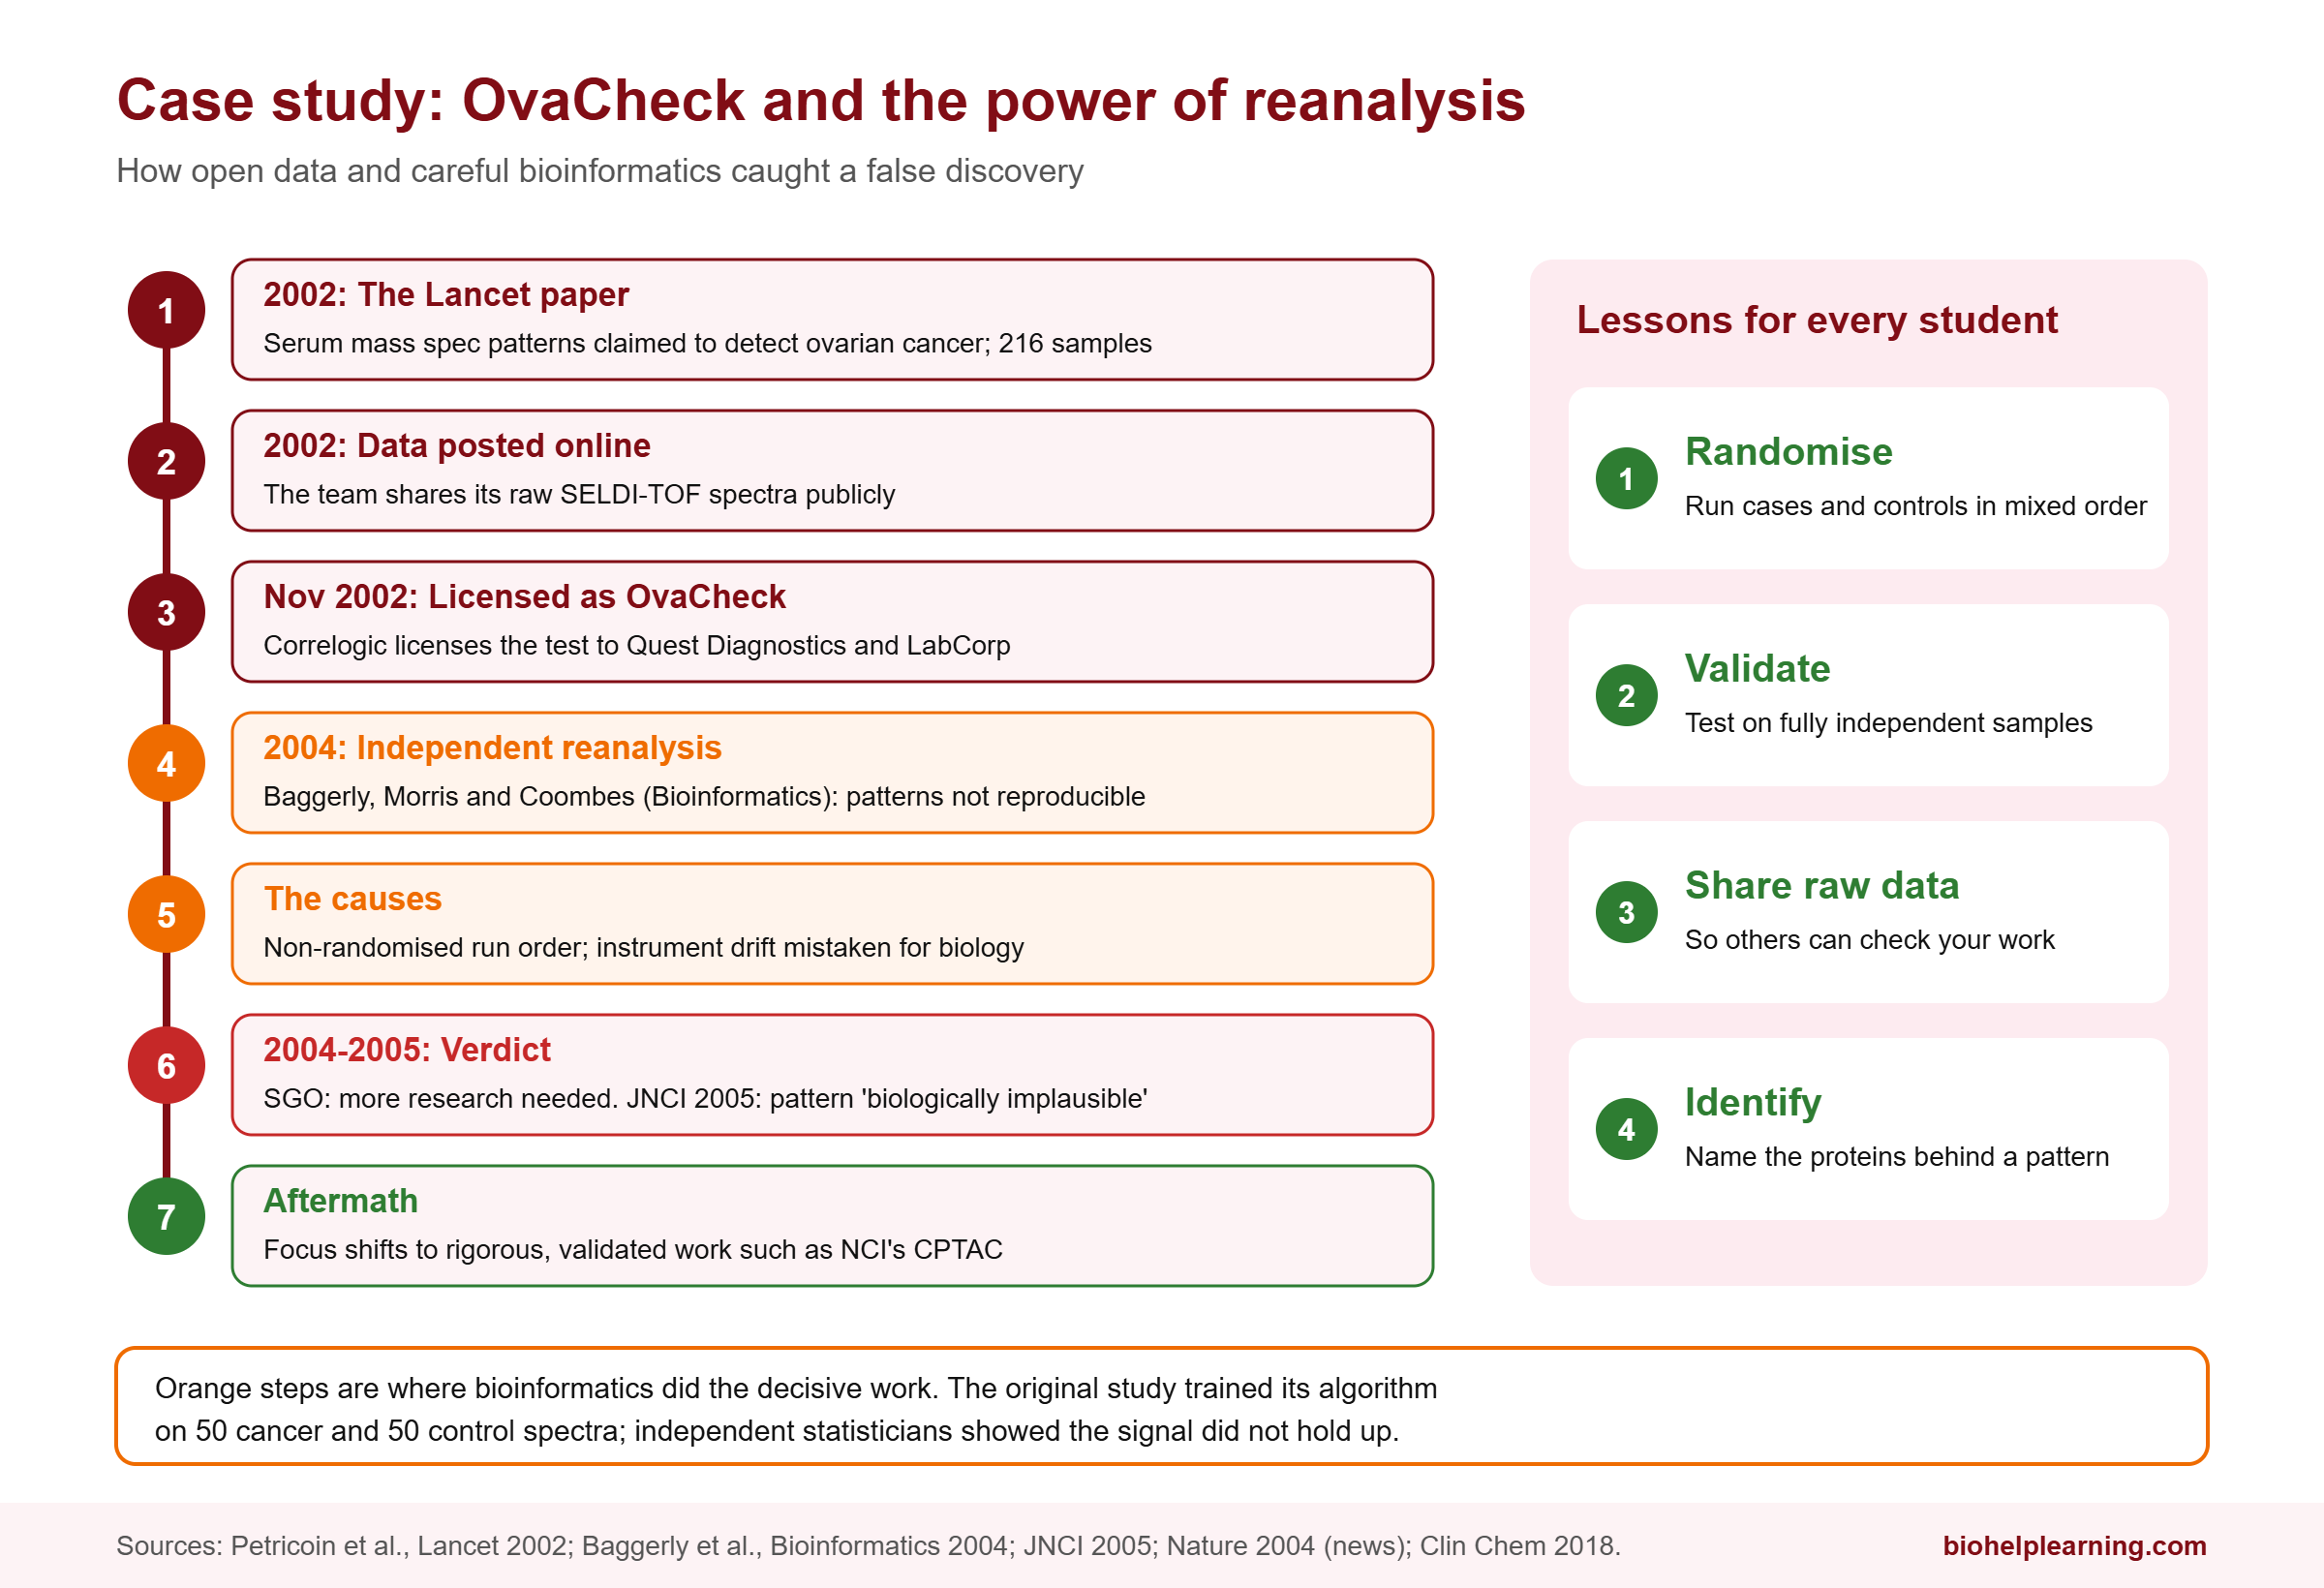
In 2002, a research team including Emanuel Petricoin and Lance Liotta published a paper in The Lancet claiming that patterns of proteins in blood serum, measured by a mass spectrometry method called SELDI-TOF, could identify ovarian cancer, even at early stages. The study started with 216 samples: 100 from women with ovarian cancer, 100 healthy controls and 16 from women with benign disease. A computer algorithm trained on 50 cancer and 50 control spectra found a discriminating pattern of peaks. Ovarian cancer is often caught late, so the results caused great excitement. In November 2002, the company Correlogic licensed the test to Quest Diagnostics and LabCorp, which planned to market it as OvaCheck.
The research team had posted their raw data online. Biostatisticians Keith Baggerly, Jeffrey Morris and Kevin Coombes at the M.D. Anderson Cancer Center reanalysed it and published their findings in Bioinformatics in 2004. They found that the discriminating patterns were not consistent between datasets, and that the samples had not been processed in a randomised order, so technical differences between runs could be mistaken for biology. In one related dataset, the mass spectrometer had begun to malfunction during the run. In a 2005 paper in the Journal of the National Cancer Institute, they concluded that the claimed pattern was “biologically implausible”. The Society of Gynecologic Oncologists reviewed the evidence and declared that more research was needed before the test could be offered.
The fallout shaped the field. Funders shifted towards more rigorous approaches; at the US National Cancer Institute, plans focused on pattern searching gave way to the Clinical Proteomic Tumor Analysis Consortium (CPTAC). The lesson is simple and permanent: randomise your sample order, validate on independent samples, and share your raw data so others can check it. That is bioinformatics doing its most valuable job.
What Is Proteomics Doing in India Today?
India has a stronger place in proteomics history than many students realise. Many co-authors of the 2014 draft map of the human proteome were based at the Institute of Bioinformatics in Bangalore, and several of the researchers were funded by Indian fellowships from CSIR, UGC and DST.
At IIT Bombay, Prof. Sanjeeva Srivastava’s proteomics laboratory runs one of the country’s well-equipped mass spectrometry facilities. During the COVID-19 pandemic, the lab used mass spectrometry on nasopharyngeal swabs and plasma from more than 200 patients to identify host and viral peptides. The group has also worked on malaria biomarkers, and Prof. Srivastava initiated the Cancer Moonshot India programme through which India joined the International Cancer Proteogenome Consortium. He also serves on the Executive Council of HUPO and the Proteomics Society, India (PSI), which holds annual meetings and student education days.
Indian proteomics data is increasingly being shared too. The Indian Biological Data Centre (IBDC) in Faridabad, which hosts the GenomeIndia data, also runs an Indian Proteome Data portal where Indian labs deposit mass spectrometry datasets, from COVID-19 plasma studies to fish gut proteomes.
For companies working across the omics space in India, see our list of top bioinformatics companies in India. For the drug-discovery angle, where proteins are the targets, read AI-driven drug discovery.
Careers in Proteomics and Bioinformatics
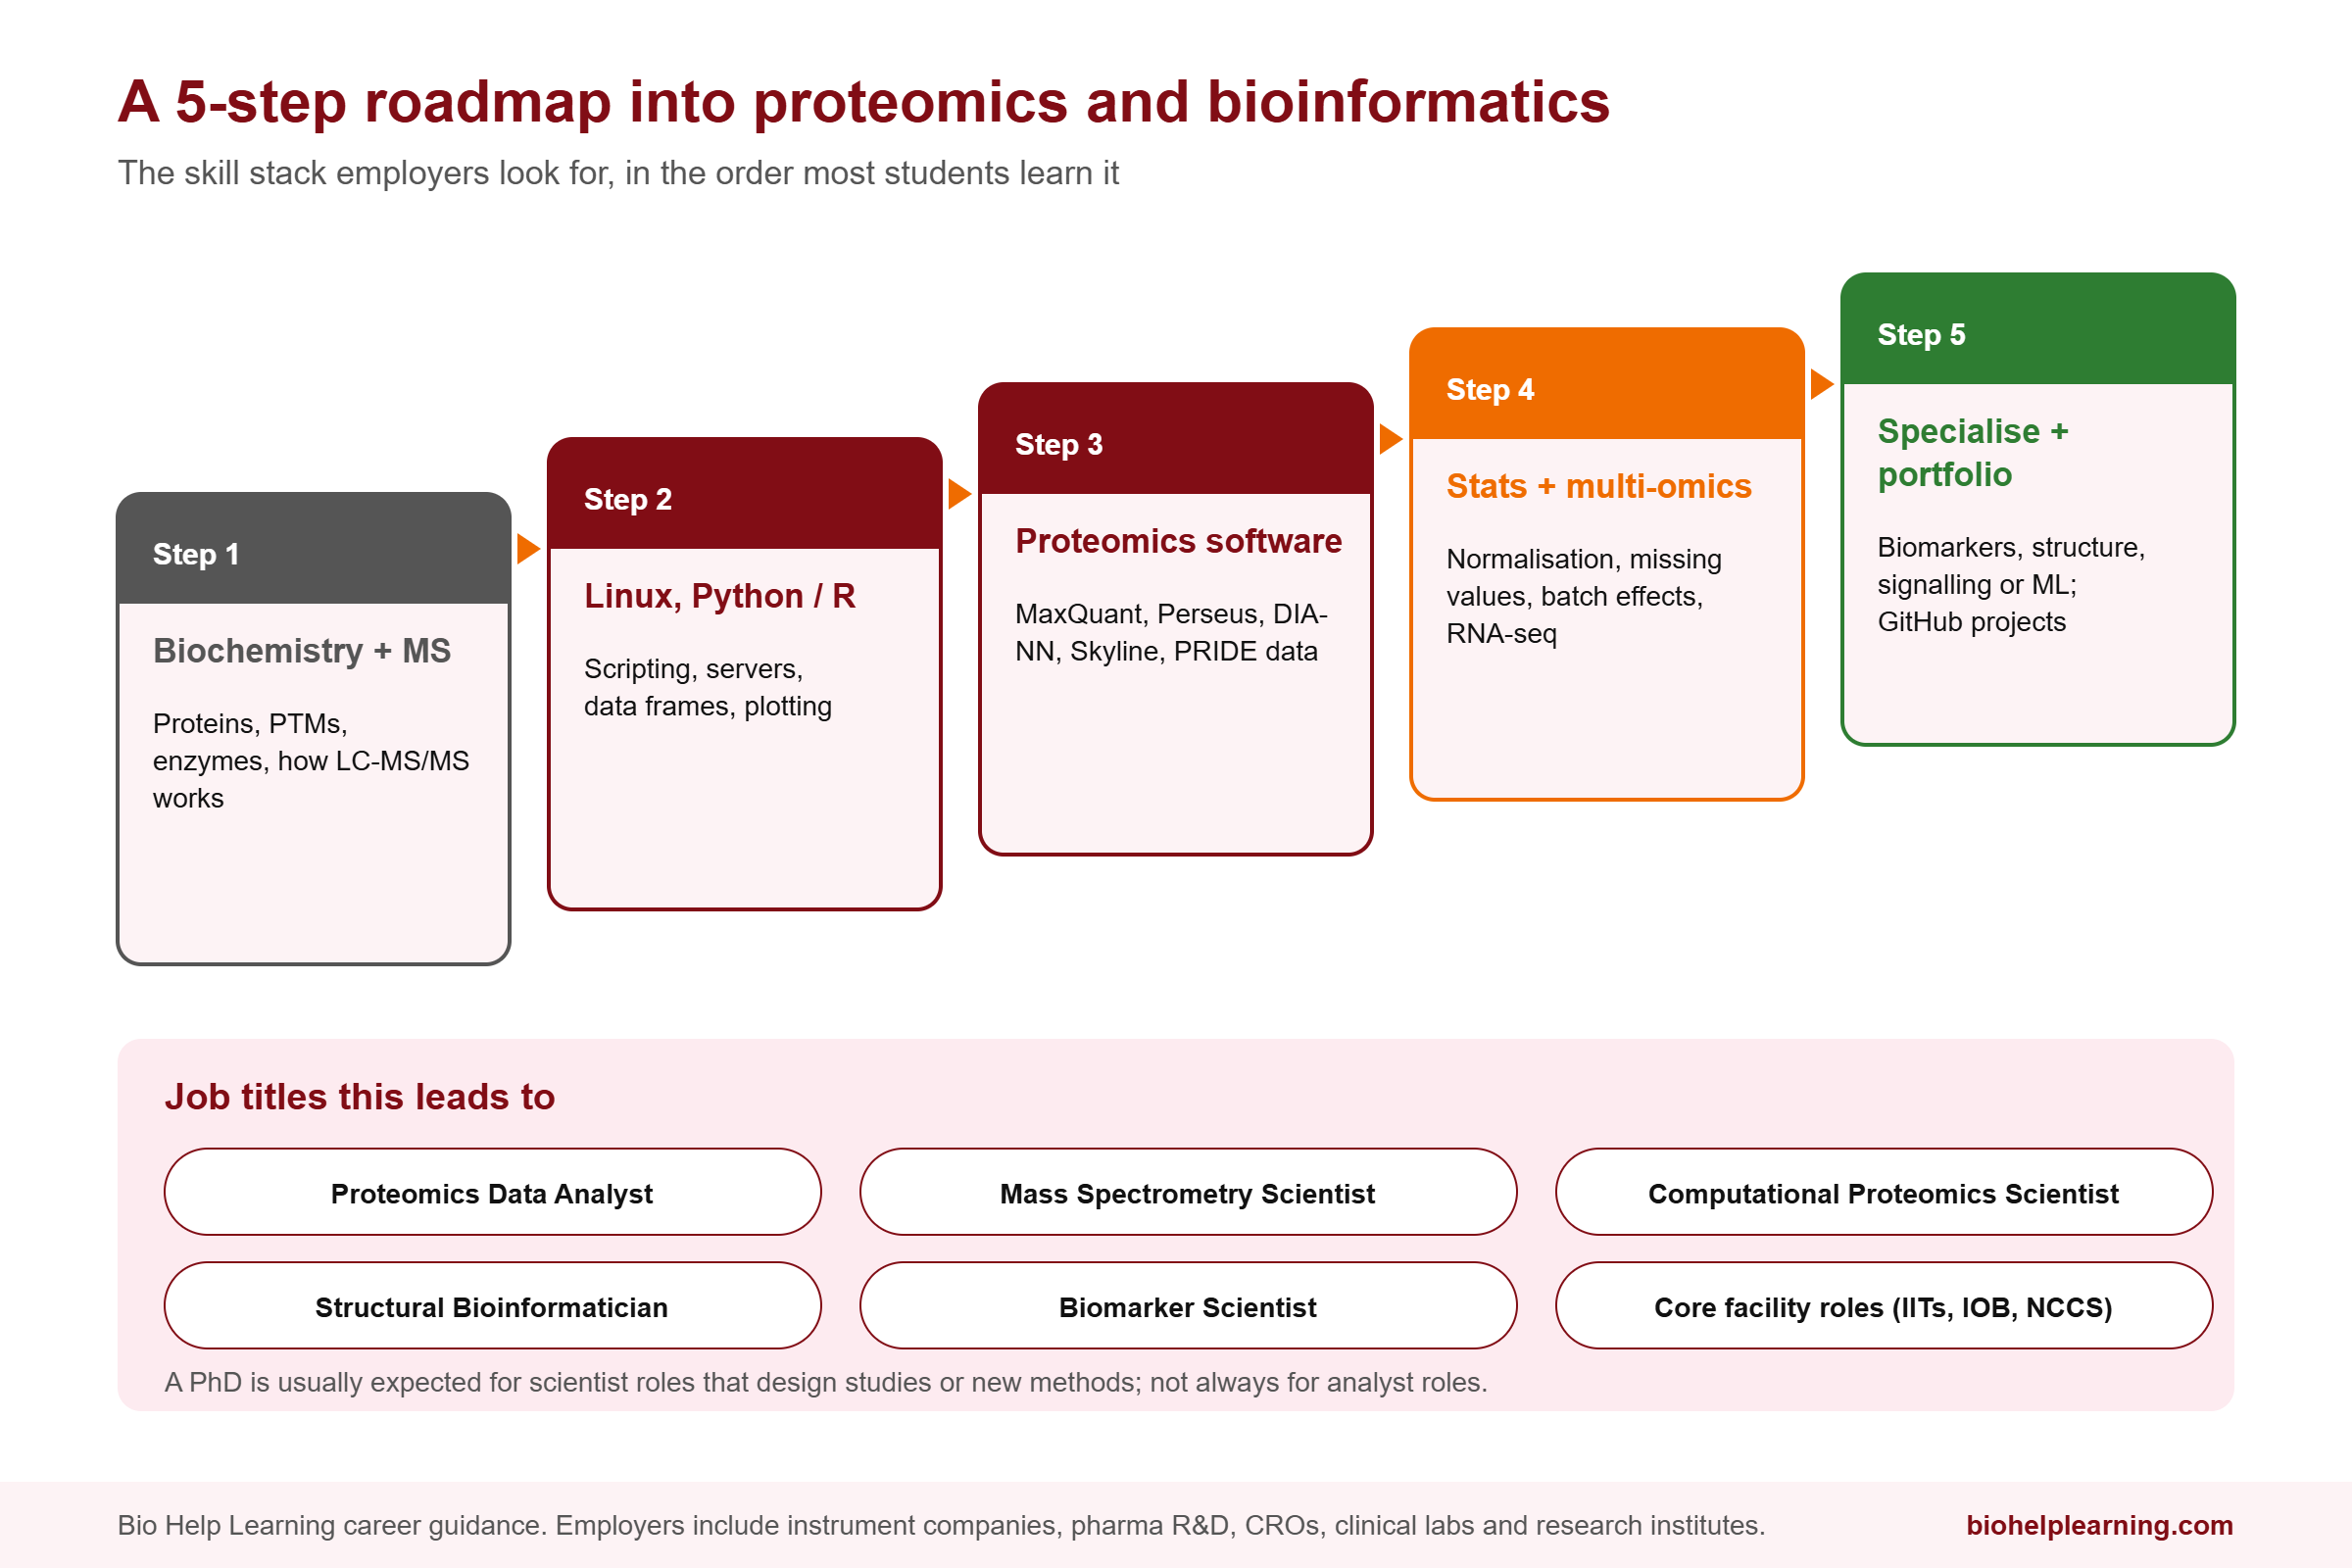
The shift from gels to software created demand for a specific kind of scientist: someone who understands both the biochemistry and the data. Here is a practical roadmap.
Step 1: Strengthen biochemistry and MS basics
Protein structure, enzymes, PTMs, and how LC-MS/MS works. You need to know what a peptide, a charge state and a fragment ion are before any software makes sense.
Step 2: Learn Linux, Python or R
Many proteomics tools run on Windows, but large-scale analysis, pipelines and downstream statistics increasingly happen in Python, R and on Linux servers or the cloud.
Step 3: Master proteomics software
Get hands-on with free tools such as MaxQuant and Perseus, DIA-NN, Skyline for targeted assays, and public data from PRIDE. Reanalysing a published dataset and reproducing its main figure is an excellent first project. Our bioinformatics project ideas for students can help you choose one.
Step 4: Statistics and multi-omics
Missing values, normalisation, batch effects and multiple testing are everyday problems in proteomics. Learn to integrate protein data with RNA-seq or genomic data, since multi-omic studies are increasingly common.
Step 5: Specialise and build a portfolio
Choose a direction: clinical biomarkers, structural proteomics with AlphaFold and molecular modelling, phosphoproteomics and signalling, or machine learning for spectra. Put your analyses on GitHub with clear documentation.
Common job titles
- Proteomics Data Analyst
- Mass Spectrometry Scientist
- Computational Proteomics Scientist
- Structural Bioinformatician
- Biomarker Scientist
Employers include mass spectrometry and proteomics companies (Thermo Fisher Scientific, for example, bought the affinity proteomics company Olink in 2024 for about $3.1 billion), pharma R&D groups, contract research organisations, clinical diagnostics labs, and research institutes such as IIT Bombay, the Institute of Bioinformatics and NCCS Pune.
Do you need a PhD?
Analyst and core-facility roles are often open to strong master’s graduates with hands-on software experience. Scientist roles that involve designing studies or developing new methods usually expect a PhD. We weigh this up in is a PhD in bioinformatics worth it in the AI era. For the full career picture, see how to become a bioinformatician and bioinformatics career scope in India.
Courses to Learn Proteomics and Bioinformatics in India
Free university courses (NPTEL / SWAYAM)
IIT Bombay’s Prof. Sanjeeva Srivastava teaches a series of free NPTEL courses that together cover most of the field:
- Mass Spectrometry Based Proteomics – a 4-week course on sample preparation, chromatography, ionisation sources, mass analysers and quantitative methods such as iTRAQ, SILAC and TMT. The certification exam is optional for a fee.
- Introduction to Proteomics – covers both gel-based and mass spectrometry-based proteomics, including lab sessions on targeted proteomics.
- Proteins and Gel-Based Proteomics – protein biology, 2D electrophoresis and MALDI-TOF identification.
- Interactomics: Basics and Applications and Introduction to Proteogenomics – for students moving into interaction studies and multi-omics.
For algorithms, BioInformatics: Algorithms and Applications by Prof. Michael Gromiha at IIT Madras is a good companion. NPTEL runs courses in fixed semesters, so check current dates on each course page. Our roundup of free bioinformatics courses lists more options.
Degree routes
MSc Biochemistry, Biotechnology or Bioinformatics with a proteomics or structural biology elective, followed by a PhD in a mass spectrometry or structural biology lab for research careers.
Industry-focused training
Proteins are central to drug discovery. Bio Help Learning’s molecular dynamics simulation with GROMACS course teaches how proteins move and bind, and the AI and machine learning for bioinformatics course covers the ML methods now used across proteomics. To start with protein-ligand interactions, read our guide on what molecular docking is.
Free self-study resources
- MaxQuant and Perseus documentation from the Cox lab.
- DIA-NN on GitHub, with example workflows.
- Skyline tutorials for targeted and DIA proteomics.
- PRIDE and EMBL-EBI Training online courses.
- The AlphaFold Protein Structure Database for exploring predicted structures.
What Proteomics and Bioinformatics Still Cannot Do
Proteomics has made huge progress, but an honest picture must include its limits.
The dynamic range problem
Blood plasma is the easiest sample to collect and the hardest to analyse. Protein concentrations in plasma span more than 10 orders of magnitude. About 20 proteins make up 99% of the total protein mass, with albumin alone accounting for more than half. Many disease-relevant proteins, such as cytokines, sit at the very bottom of that range, where mass spectrometry struggles to see them.
Biomarkers rarely reach the clinic
Thousands of papers have reported candidate protein biomarkers, but very few become approved tests. As early as 2002, Leigh and Norman Anderson noted that the rate of new protein diagnostic markers had fallen to less than one per year, despite all the promise of proteomics. Discovery is the easy part; validation in large, independent patient groups is where most candidates fail, as OvaCheck showed.
The last missing proteins
About 6% of human protein-coding genes still have no confident protein evidence, and progress on finding them has slowed. Some may be made only in specific cells, at specific times, or in amounts too small to detect with current instruments.
Predicted structures are not the whole story
AlphaFold predicts a protein’s most likely shape, with a confidence score for each region. It does not show how a protein moves, how it changes when a drug binds, or how mutations destabilise it. Low-confidence regions should not be treated as real structures. Experiments and simulation are still needed. Our article will AI replace bioinformaticians explores why expert judgement still matters.
Reproducibility and batch effects
Results depend on sample collection, storage, instrument condition, run order and software settings. Different platforms, such as mass spectrometry and antibody-based assays, can disagree for the same protein. Careful study design and transparent data sharing remain essential.
Cost and access
High-resolution mass spectrometers are expensive to buy and maintain, and they need trained operators. Many labs share instruments through central facilities, which makes people who can analyse the data well even more valuable.
Frequently Asked Questions
What is proteomics in simple words?
Proteomics is the large-scale study of all the proteins in a cell, tissue or organism. It measures which proteins are present, how much of each, how they are chemically modified and how they interact, usually using mass spectrometry and bioinformatics.
What is the difference between genomics and proteomics?
Genomics studies DNA, which is mostly the same in every cell and stays fixed. Proteomics studies proteins, which differ between cell types and change over time. Genomics tells you what a cell could make; proteomics tells you what it is actually making.
How did bioinformatics change proteomics?
Bioinformatics turned mass spectra into protein identities through database search tools like SEQUEST, added statistical error control, made large-scale quantification possible with tools like MaxQuant and DIA-NN, predicted structures for about 200 million proteins with AlphaFold, and enabled public sharing of tens of thousands of datasets.
Which software is used in proteomics data analysis?
Common free tools include MaxQuant and Perseus for identification, quantification and statistics, DIA-NN for data-independent acquisition, and Skyline for targeted assays. Commercial options include Proteome Discoverer, which contains the SEQUEST HT search engine, and Spectronaut. Downstream work is often done in R or Python.
Is proteomics a good career in India?
It is a niche but growing field. The strongest demand is for people who combine protein biochemistry with data analysis skills, in pharma R&D, clinical research, instrument companies and research institutes. Hands-on data analysis skills make you far more employable than instrument experience alone.
What is the Human Proteome Project?
It is an international project coordinated by HUPO since 2010 to find evidence for at least one protein from every human protein-coding gene, and to work out what each protein does. Its 2025 report found that 93.6% of the 19,435 proteins in its reference list have been detected.
Can AlphaFold replace experimental proteomics?
No. AlphaFold predicts static structures from sequence. It does not tell you which proteins are present in a sample, how much there is, how they are modified, or how they change with disease. Those questions still need mass spectrometry and other experiments.
Key Takeaways
- Proteomics studies all the proteins in a biological system; unlike the genome, the proteome changes with cell type, time and condition.
- Soft ionisation methods (ESI and MALDI), recognised by the 2002 Nobel Prize, made mass spectrometry the core tool of proteomics.
- SEQUEST (1994) linked spectra to sequence databases and made protein identification a bioinformatics problem.
- Software such as MaxQuant, DIA-NN and AlphaFold, plus public repositories like PRIDE, transformed quantification, structure and data sharing.
- The OvaCheck episode showed that rigorous bioinformatics is as important for catching false discoveries as for making real ones.
- Big limits remain: plasma dynamic range, slow biomarker translation, missing proteins and the gap between predicted and real protein behaviour.
References and Further Reading
- Kim M.-S. et al. A draft map of the human proteome. Nature 509, 575–581 (2014). DOI: 10.1038/nature13302
- Eng J.K., McCormack A.L., Yates J.R. An approach to correlate tandem mass spectral data of peptides with amino acid sequences in a protein database. J Am Soc Mass Spectrom 5, 976–989 (1994). DOI: 10.1016/1044-0305(94)80016-2
- Cox J., Mann M. MaxQuant enables high peptide identification rates, individualized p.p.b.-range mass accuracies and proteome-wide protein quantification. Nature Biotechnology 26, 1367–1372 (2008). DOI: 10.1038/nbt.1511
- Demichev V. et al. DIA-NN: neural networks and interference correction enable deep proteome coverage in high throughput. Nature Methods 17, 41–44 (2020). DOI: 10.1038/s41592-019-0638-x
- Sun B.B. et al. Plasma proteomic associations with genetics and health in the UK Biobank. Nature 622, 329–338 (2023). DOI: 10.1038/s41586-023-06592-6
- Deutsch E.W. et al. The 2025 Report on the Human Proteome from the HUPO Human Proteome Project. J Proteome Res 25(2), 539–555 (2026). DOI: 10.1021/acs.jproteome.5c00759
- Perez-Riverol Y. et al. The PRIDE database at 20 years: 2025 update. Nucleic Acids Res 53(D1), D543–D553 (2025). DOI: 10.1093/nar/gkae1011
- The ProteomeXchange consortium in 2026: making proteomics data FAIR. Nucleic Acids Res 54(D1), D459–D469 (2026). DOI: 10.1093/nar/gkaf1146
- Baggerly K.A., Morris J.S., Coombes K.R. Reproducibility of SELDI-TOF protein patterns in serum: comparing datasets from different experiments. Bioinformatics 20(5), 777–785 (2004). DOI: 10.1093/bioinformatics/btg484
- Anderson N.L., Anderson N.G. The human plasma proteome: history, character, and diagnostic prospects. Mol Cell Proteomics 1(11), 845–867 (2002). DOI: 10.1074/mcp.r200007-mcp200
- Nobel Prize in Chemistry 2002, press release. nobelprize.org
- EMBL. AlphaFold wins Nobel Prize in Chemistry 2024. embl.org
- NPTEL. Mass Spectrometry Based Proteomics (IIT Bombay). onlinecourses.nptel.ac.in
- Indian Biological Data Centre – Indian Proteome Data portal. ibdc.dbtindia.gov.in