
Quality Control of NGS Reads with FastQC and MultiQC
FastQC tutorial · Chapter 1 of 5: Why QC matters, FASTQ and Phred scores
This FastQC tutorial starts where every NGS analysis starts, with one question: can I trust these reads? A sequencing run gives you millions of reads, and some of them carry low-quality bases, leftover adapter sequence or contamination. If you skip quality control (QC), those problems quietly flow into alignment, variant calling and expression analysis, and you only notice when the results look wrong.
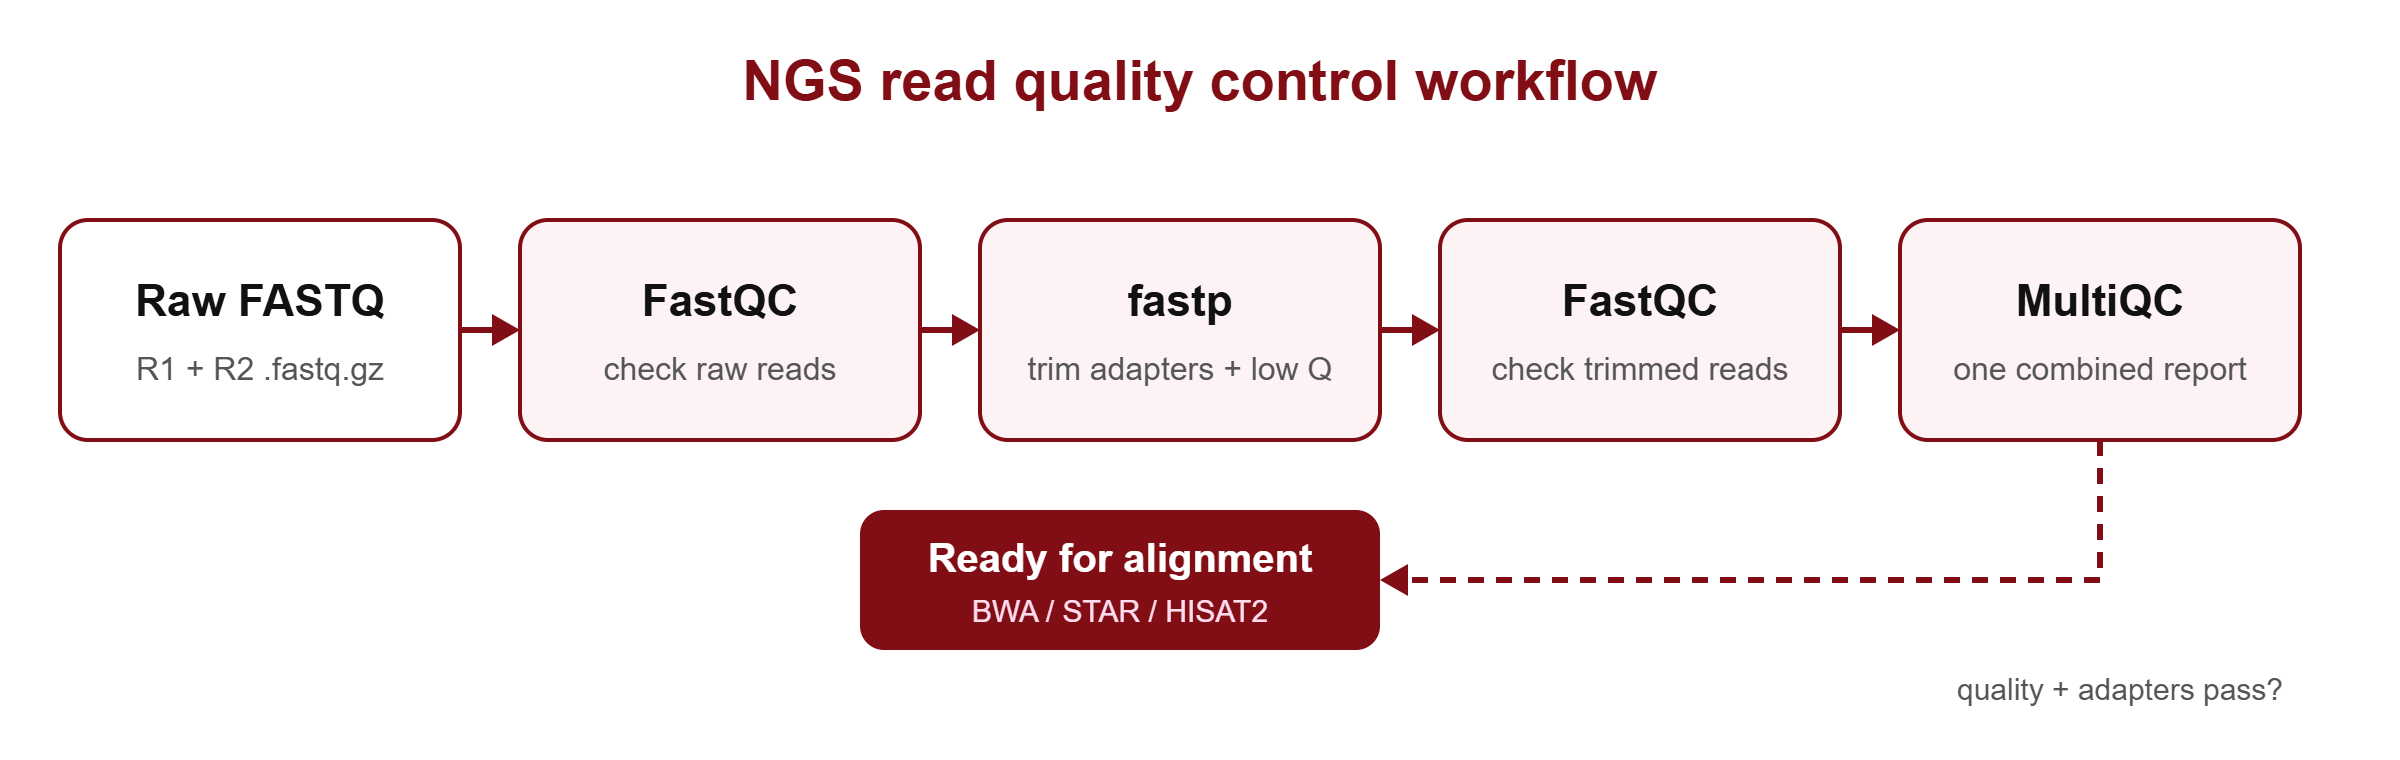
In this tutorial you will learn FastQC step by step: you will check paired-end Illumina reads with FastQC, clean them with fastp, and compare before-and-after results in one report with MultiQC. Along the way you will learn how the FASTQ format and Phred scores work, what each FastQC module measures and when it really matters, and how the trimming algorithms decide what to cut.
Choose your reading path
Click a path to choose. With no choice made, the whole page is shown. ▸ Go deeper sections open on click; 🔬 Researcher notes boxes give published evidence, tool defaults and pitfalls. Your choice is remembered on this device.
Chapters:
- Why QC matters, FASTQ and Phred scores
- Running and reading FastQC
- Adapters and trimming
- MultiQC, automation and contamination
- Practice, FAQ and references
What you will learn in this FastQC tutorial
- Read a FASTQ record and decode its quality characters
- Explain Phred scores and the Phred+33 encoding
- Run FastQC and interpret every important module, including FastQC’s own pass, warn and fail thresholds
- Know which warnings are normal for RNA-seq, amplicon and other data types
- Understand why adapters appear and how fastp finds and removes them
- Understand sliding-window quality trimming
- Combine all reports with MultiQC and decide whether data is ready for alignment
- Run the whole workflow for many samples with one loop
- Understand the sequencing chemistry behind quality scores and poly-G tails (Go deeper)
- Judge when trimming helps, using published evidence (Researcher notes)
- Screen reads for contamination with FastQ Screen and Kraken2
- Report QC properly in a thesis or paper
Why read quality control matters
Illumina sequencers read DNA by building a complementary strand one base per cycle and recording a fluorescent signal. With every cycle, a few molecules in each cluster fall out of step (phasing), so the signal gets noisier towards the end of the read. That is why base quality usually drops at the 3′ end.
Poor-quality reads cause real problems downstream:
- Lower mapping rate: adapter bases and errors stop reads from aligning to the reference.
- False variants: low-quality bases look like SNPs or indels in variant calling.
- Biased expression counts: in RNA-seq, untrimmed adapters and rRNA contamination distort gene counts.
- Wasted time: alignment of bad data takes hours, and you may have to redo everything.
▸ Go deeper: how Illumina sequencing creates quality scores
Illumina instruments use sequencing by synthesis (SBS). Each DNA fragment is copied into a cluster of about a thousand identical molecules on a flow cell. In every cycle, fluorescently labelled nucleotides with a removable “terminator” are added, exactly one base is built onto each strand, the flow cell is imaged, and the dye and terminator are washed off before the next cycle.
Phasing and pre-phasing: in each cycle a small fraction of molecules in a cluster fails to add a base (falls behind) or adds an extra one (runs ahead). These out-of-step molecules give off the “wrong” colour, so the cluster’s signal becomes a mixture. The fraction grows with every cycle, the base caller becomes less certain, and quality falls towards the 3′ end of the read.
Two-colour chemistry: NovaSeq 6000 and NextSeq 500/550 read four bases with only two images. On the NovaSeq 6000, C appears only in the red image, T only in green, A in both, and G gives no signal at all. Newer XLEAP-SBS chemistry (NovaSeq X, NextSeq 1000/2000) changes the dye pairing, but G is still the “dark” base.
This has a famous side effect: when a read runs past the end of a short fragment, or a cluster fades, the instrument sees darkness and calls it G with high confidence. You get long poly-G tails (GGGGGGGG…) at read ends. fastp trims poly-G tails automatically for NextSeq and NovaSeq data, and Cutadapt has --nextseq-trim, which treats G bases as low quality during tail trimming.
🔬 Researcher notes: quality scores are predictions, not measurements
- A Phred score is the base caller’s predicted error probability from a calibrated model, using the same Q = −10 log10(P) formula introduced for Sanger sequencing (Ewing & Green 1998). Illumina checks calibration with Q-Q plots of predicted against empirical error.
- Binned scores: to save storage, modern instruments report only a few quality values. NovaSeq 6000 and NextSeq 1000/2000 use a three-bin table whose top bin covers all bases of Q30 and above; NovaSeq X reports Q12, Q23 and Q40 (moved to Q26 and Q40 in control software v1.2). In FastQC this makes per-base quality boxplots look stepped or flat, and small quality changes become invisible.
- Illumina reports that qualities above about Q35 have very little effect on germline variant calling with modern callers; accuracy is limited mainly by coverage.
- Errors created before sequencing, such as PCR errors or oxidative DNA damage during library preparation, are not reflected in base qualities at all. Read-level QC cannot detect them; they appear later as low-frequency artefactual variants.
Understanding the FASTQ format
Raw reads come in FASTQ files (usually compressed as .fastq.gz). Every read takes exactly four lines:
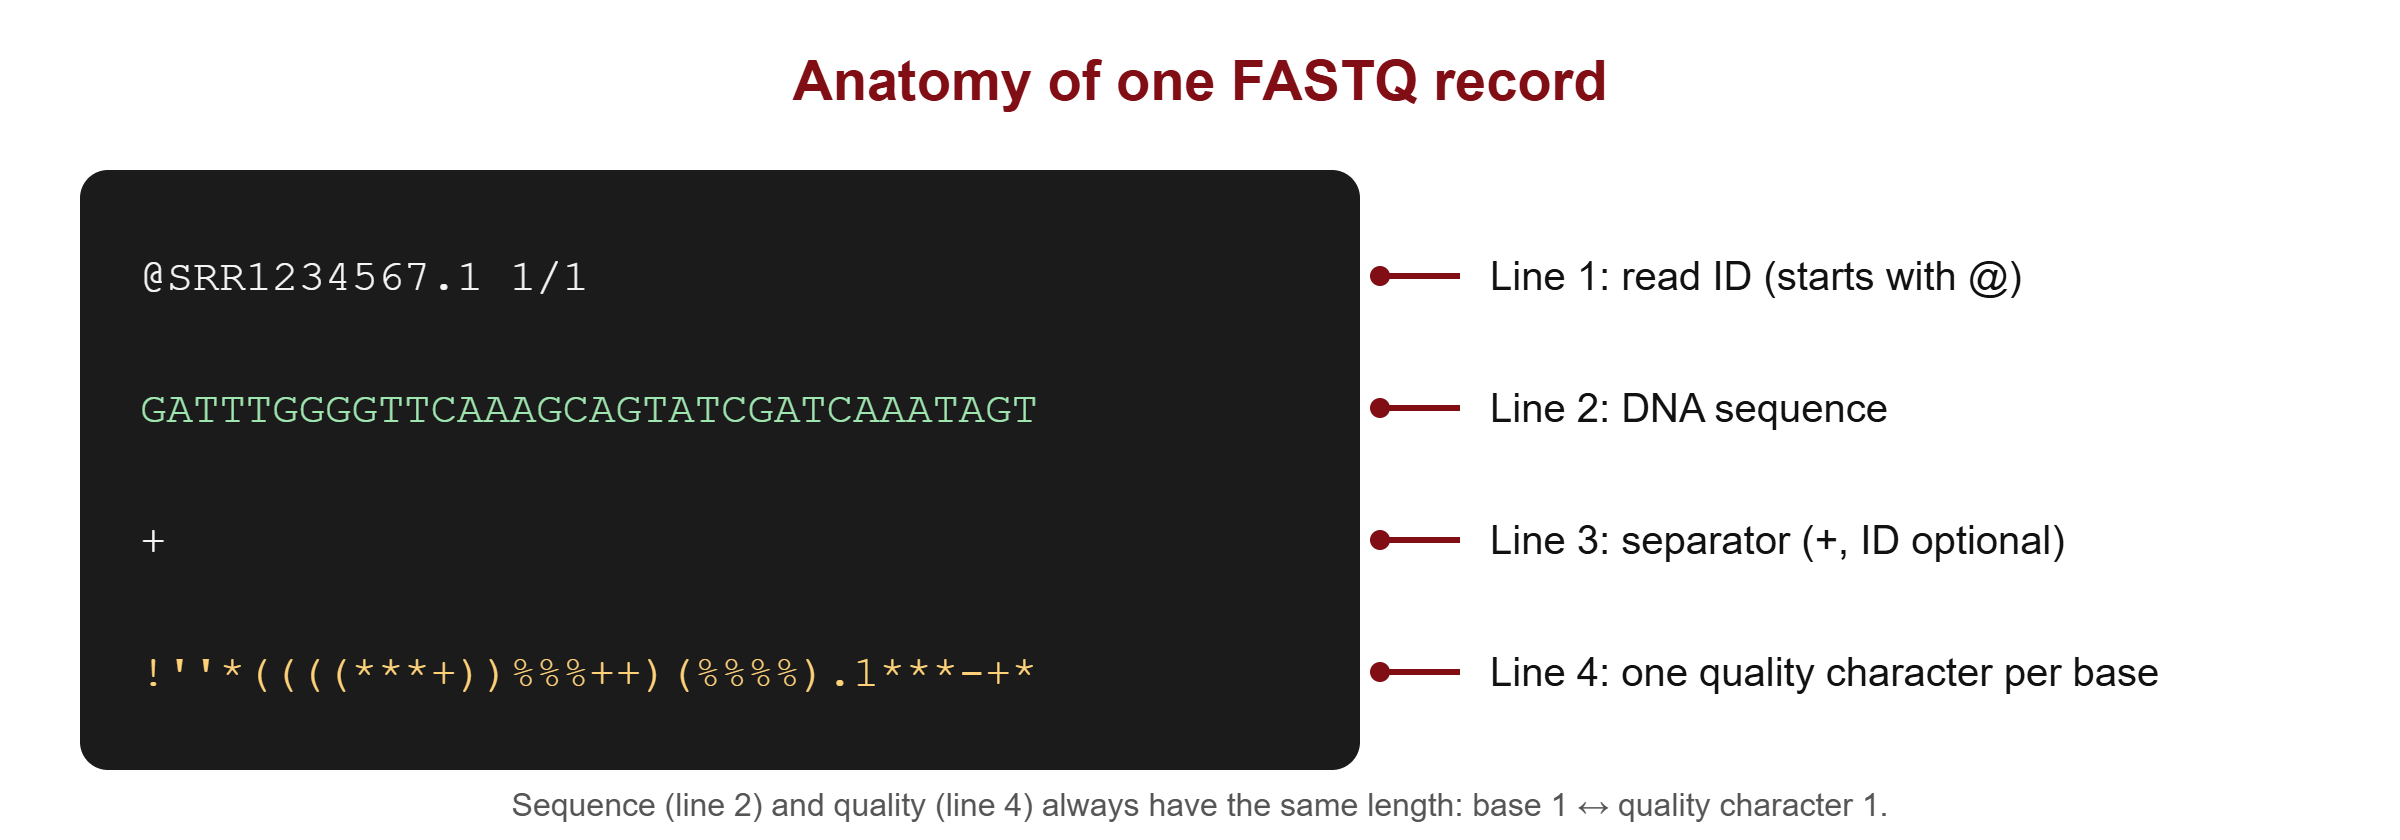
- Line 1 starts with
@and holds the read ID (instrument, run, flow cell position). - Line 2 is the base sequence (A, C, G, T, and N for an unknown base).
- Line 3 starts with
+and may repeat the ID. - Line 4 holds one quality character per base.
In paired-end sequencing, each DNA fragment is read from both ends. Read 1 goes in sample_R1.fastq.gz and its mate in sample_R2.fastq.gz, in the same order. Tools must always receive both files together so the pairs stay matched.
Look at the first two reads and count the reads in a file:
zcat sample_R1.fastq.gz | head -8

# number of reads = number of lines / 4
echo $(( $(zcat sample_R1.fastq.gz | wc -l) / 4 ))▸ Go deeper: reading an Illumina read header and checking paired files
Since Illumina software 1.8, read IDs follow this pattern:
@A00123:45:HXXXXDSXX:1:1101:2718:1000 1:N:0:ATCACG
  │      │  │         │ │    │    │    │ │ │ └ index (barcode) sequence
  │      │  │         │ │    │    │    │ │ └ control number (0 = none)
  │      │  │         │ │    │    │    │ └ Y = failed the instrument filter, N = passed
  │      │  │         │ │    │    │    └ read number (1 or 2)
  │      │  │         │ │    │    └ y-coordinate of the cluster
  │      │  │         │ │    └ x-coordinate of the cluster
  │      │  │         │ └ tile number
  │      │  │         └ lane
  │      │  └ flow cell ID
  │      └ run number
  └ instrument ID
These fields are not decoration. FastQC’s Per tile sequence quality module uses the lane and tile numbers, and duplicate-marking tools use the x/y coordinates to recognise optical duplicates (the same cluster read twice by the camera).
Paired files must contain the same reads in the same order. Check that the first IDs match and that both files contain the same number of reads:
paste <(zcat sample_R1.fastq.gz | awk 'NR%4==1') <(zcat sample_R2.fastq.gz | awk 'NR%4==1') | head -3

# quick statistics for both files: reads, length, Q20/Q30 %
seqkit stats -a sample_R1.fastq.gz sample_R2.fastq.gz🔬 Researcher notes: quality encodings and why they still bite
- FASTQ has had several incompatible quality encodings (Cock et al. 2010): Sanger / Phred+33; Solexa+64 (Solexa scores, which can be negative and are not Phred scores); Illumina 1.3–1.7 Phred+64; and from Illumina 1.8 onwards, back to Phred+33.
- If a tool assumes the wrong offset, every quality is shifted by 31. Trimming then removes almost everything, or nothing, without any error message. Check the Encoding line in FastQC’s Basic Statistics before you trim old or third-party data.
- Reads downloaded from SRA with
fasterq-dumpare written as Phred+33, but the original quality values may already have been binned or simplified.
Phred quality scores and how they are encoded
Each quality character stands for a Phred score (Q), which tells you the probability (P) that the base call is wrong:
Q = -10 × log10(P)        and        P = 10^(-Q/10)

Example: Q = 30  →  P = 10^(-3) = 0.001  →  1 wrong base in 1,000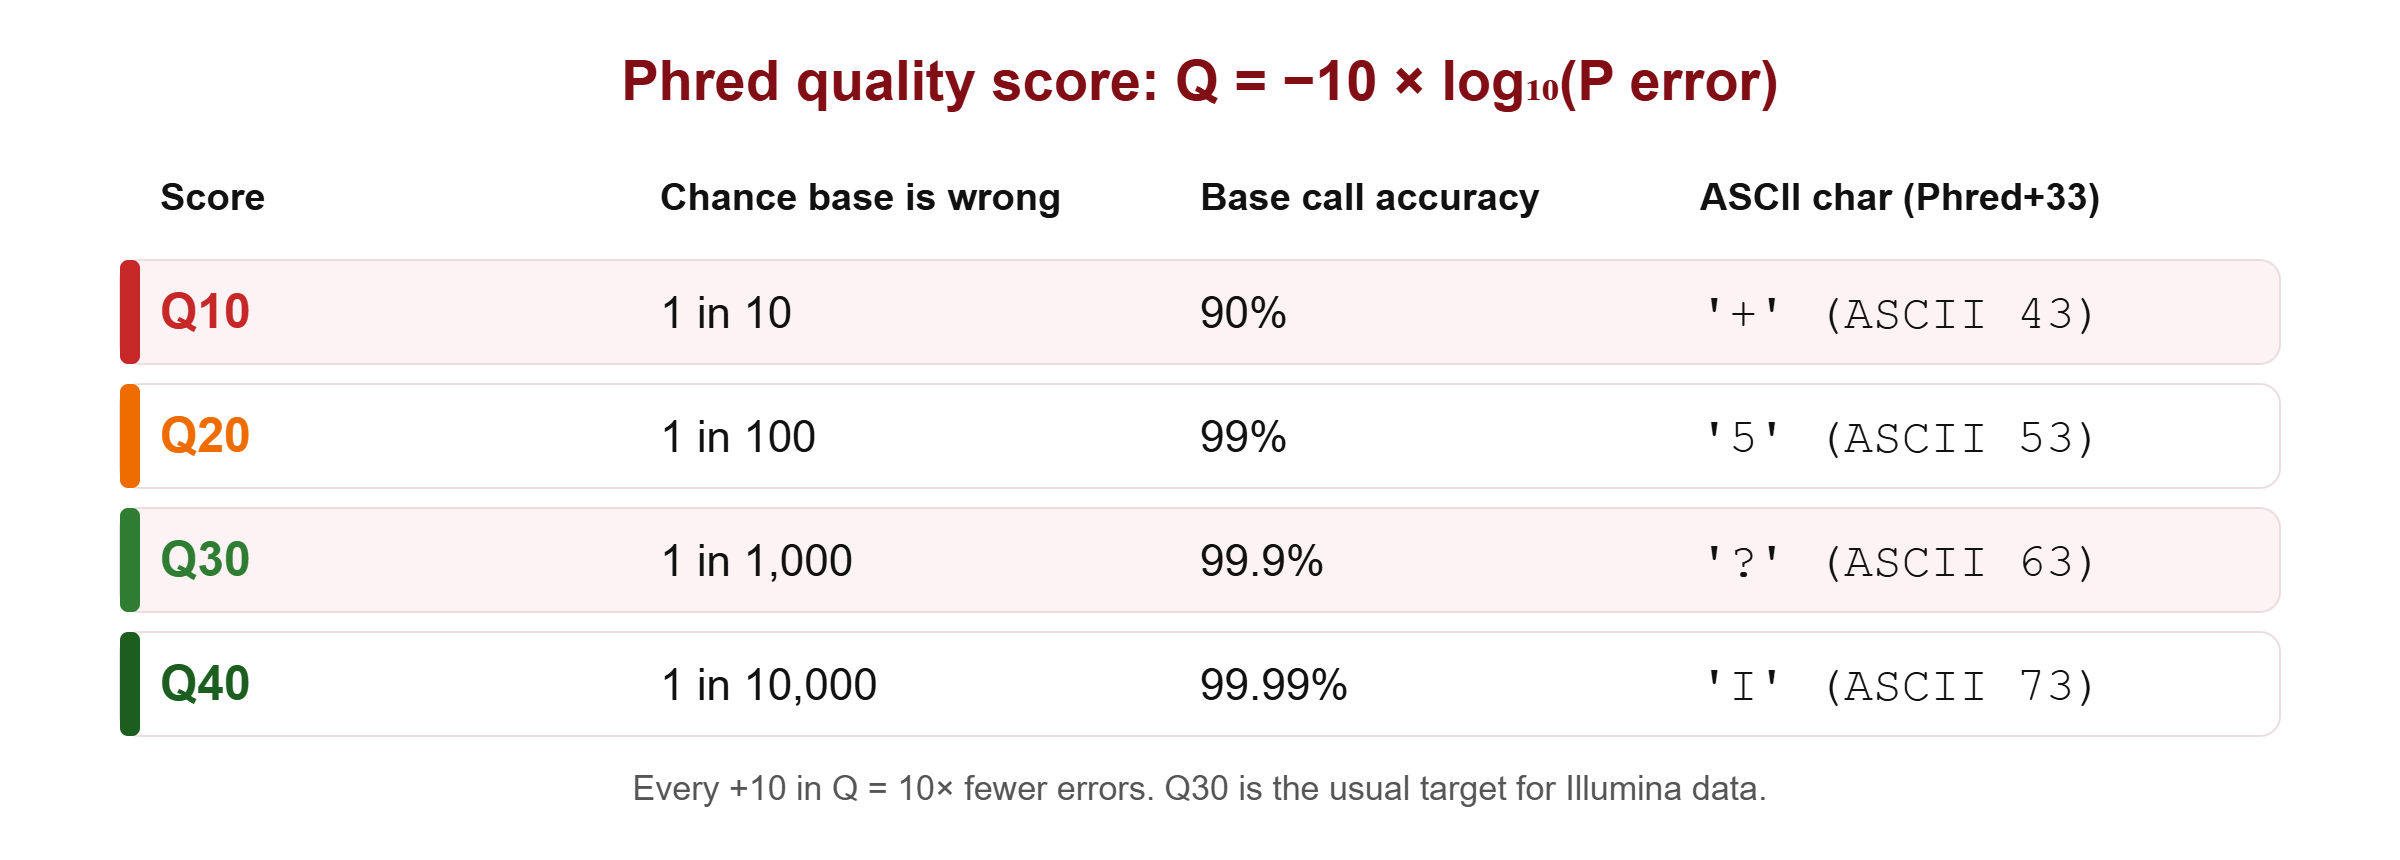
To store a number as one character, the score is added to 33 and written as the ASCII character with that code. This is Phred+33 (Sanger / Illumina 1.8+) encoding. For example I is ASCII 73, so its score is 73 − 33 = 40. Very old Illumina data (version 1.3–1.7) used Phred+64; FastQC detects the encoding for you and shows it in the Basic Statistics module.
You can decode a quality string yourself with one line of Python:
python3 -c "q='II?5+#'; print([ord(c)-33 for c in q])"▸ Go deeper: expected errors, and why you should never average Q values
Because Q is a logarithm, averaging Q values hides errors. Add up the error probabilities instead. The sum is the expected number of errors in the read (Edgar & Flyvbjerg 2015), the measure behind Cutadapt’s --max-ee filter.
| Read (100 bases) | Mean Q | Expected errors |
|---|---|---|
| 100 bases at Q30 | 30 | 100 × 0.001 = 0.10 |
| 90 bases at Q30 + 10 bases at Q10 | 28 | 0.09 + 1.0 = 1.09 |
The second read looks almost as good by its mean Q (28 against 30), but it carries about ten times more errors. Try it yourself:
python3 - <<'EOF'
q1 = [30] * 100
q2 = [30] * 90 + [10] * 10
ee = lambda q: sum(10 ** (-x / 10) for x in q)
for name, q in (('read 1', q1), ('read 2', q2)):
    print(name, 'mean Q =', sum(q) / len(q), ' expected errors =', round(ee(q), 2))
EOF🔬 Researcher notes: base quality recalibration
Before variant calling, GATK’s Base Quality Score Recalibration (BQSR) re-estimates base qualities empirically from mismatches at positions that are not known variant sites, correcting systematic errors linked to sequencing cycle and sequence context (DePristo et al. 2011). Read-level QC and BQSR answer different questions: QC asks whether the run is usable; BQSR makes the remaining quality values trustworthy for genotype likelihoods.
Quick check: a base has the quality character I (ASCII 73). What is its Phred score and error probability?
73 − 33 = Q40, so the probability that the base is wrong is 10−4 = 1 in 10,000.
Quick check: why is the mean Q of a read a poor summary of its quality?
Q is logarithmic. A few very low-quality bases add many expected errors but lower the mean only slightly. Sum the error probabilities (expected errors) instead.