
Quality Control of NGS Reads with FastQC and MultiQC
Chapter 2 of 5: Running and reading FastQC
What you need
- A Linux or macOS terminal. On Windows, use WSL2 with Ubuntu.
- Conda or Mamba with the conda-forge and bioconda channels.
- About 2 GB of free disk space for the tools and test data.
- A pair of FASTQ files from paired-end sequencing: your own data, any paired-end Illumina run from SRA, or the ready-made tutorial dataset in the study material below (100,000 read pairs, made to show adapter and quality problems clearly).
Step 1: Install FastQC, fastp and MultiQC
Create a separate environment so these tools do not clash with your other software:
conda create -n qc -c conda-forge -c bioconda fastqc fastp multiqc
conda activate qc
fastqc --version
fastp --version
multiqc --version▸ Go deeper: making your QC reproducible
A result you cannot reproduce is not a result. Two habits make QC reproducible: record exact versions and freeze the environment.
# save the exact environment (shareable with your thesis or paper)
conda env export --no-builds > qc_environment.yml

# later, or on another computer
conda env create -f qc_environment.yml
For full portability, run the tools from a container. BioContainers publishes images for every Bioconda package (for example quay.io/biocontainers/fastqc). Pin and record the image tag, and you get the same software on a laptop, a server or an HPC cluster.
🔬 Researcher notes: pipelines and reporting
Community pipelines such as those from nf-core bundle FastQC, a trimming step and MultiQC with pinned software and record the versions used in every run. If you write your own scripts, report every tool version and every non-default parameter in your Methods section (a ready template is in the FAQ at the end).
Step 2: Run FastQC on the raw reads
Make a folder for the reports and run FastQC on both files. -t 4 uses 4 CPU threads; lower it on a small laptop.
mkdir -p qc_raw
fastqc sample_R1.fastq.gz sample_R2.fastq.gz -o qc_raw/ -t 4What FastQC does internally: it reads every sequence once and builds summary statistics per position (quality, base composition, N content) and per read (mean quality, GC content, length). To save memory, the duplication and overrepresented-sequence modules only track sequences that first appear in the first 100,000 reads of the file. Each module is then compared with fixed thresholds to give a pass, warn or fail.
▸ Go deeper: useful FastQC options and output files
| Option | What it does |
|---|---|
--nogroup | Shows every base position separately. By default, FastQC groups positions into bins for reads longer than 50 bp, which can hide a problem at one cycle. |
-a FILE / -c FILE | Use your own adapter or contaminant list (for example custom primers or UMI adapters). |
-l FILE | Use your own warn/fail limits (see the Researcher notes in Step 3). |
--extract | Unzips the results, giving fastqc_data.txt (all numbers, machine-readable) and summary.txt (PASS/WARN/FAIL per module). |
--memory 1024 | Gives FastQC more memory (FastQC 0.12+). Useful for long reads or very large files. |
-t 4 | Processes up to 4 files in parallel. One file always uses one thread. |
fastqc --nogroup --extract -t 4 -o qc_raw/ sample_R1.fastq.gz sample_R2.fastq.gz
cat qc_raw/sample_R1_fastqc/summary.txt🔬 Researcher notes: how FastQC really computes its numbers
- Duplication and overrepresented sequences are estimated from a sample. Only sequences that first appear in the first 100,000 reads are tracked through the whole file, and long reads are truncated to 50 bp for the duplicate test. If your file is sorted or concatenated from several runs, the first 100,000 reads may not be representative.
- FastQC treats R1 and R2 as unrelated single-end files. It cannot use the mate to tell PCR duplicates from natural duplicates, so its duplication levels are inflated for RNA-seq and deep sequencing. Paired-aware tools (fastp before alignment, Picard MarkDuplicates after alignment) give more realistic estimates.
- The k-mer module is switched off by default in the shipped configuration. Enable it by setting
kmer ignore 0in a limits file. - Per tile sequence quality compares each tile with the average for that cycle. Tile-specific drops point to flow-cell problems such as bubbles or debris, not to your library. Defaults: warn at a loss of 5 Phred points, fail at 10.
Step 3: Read the FastQC report
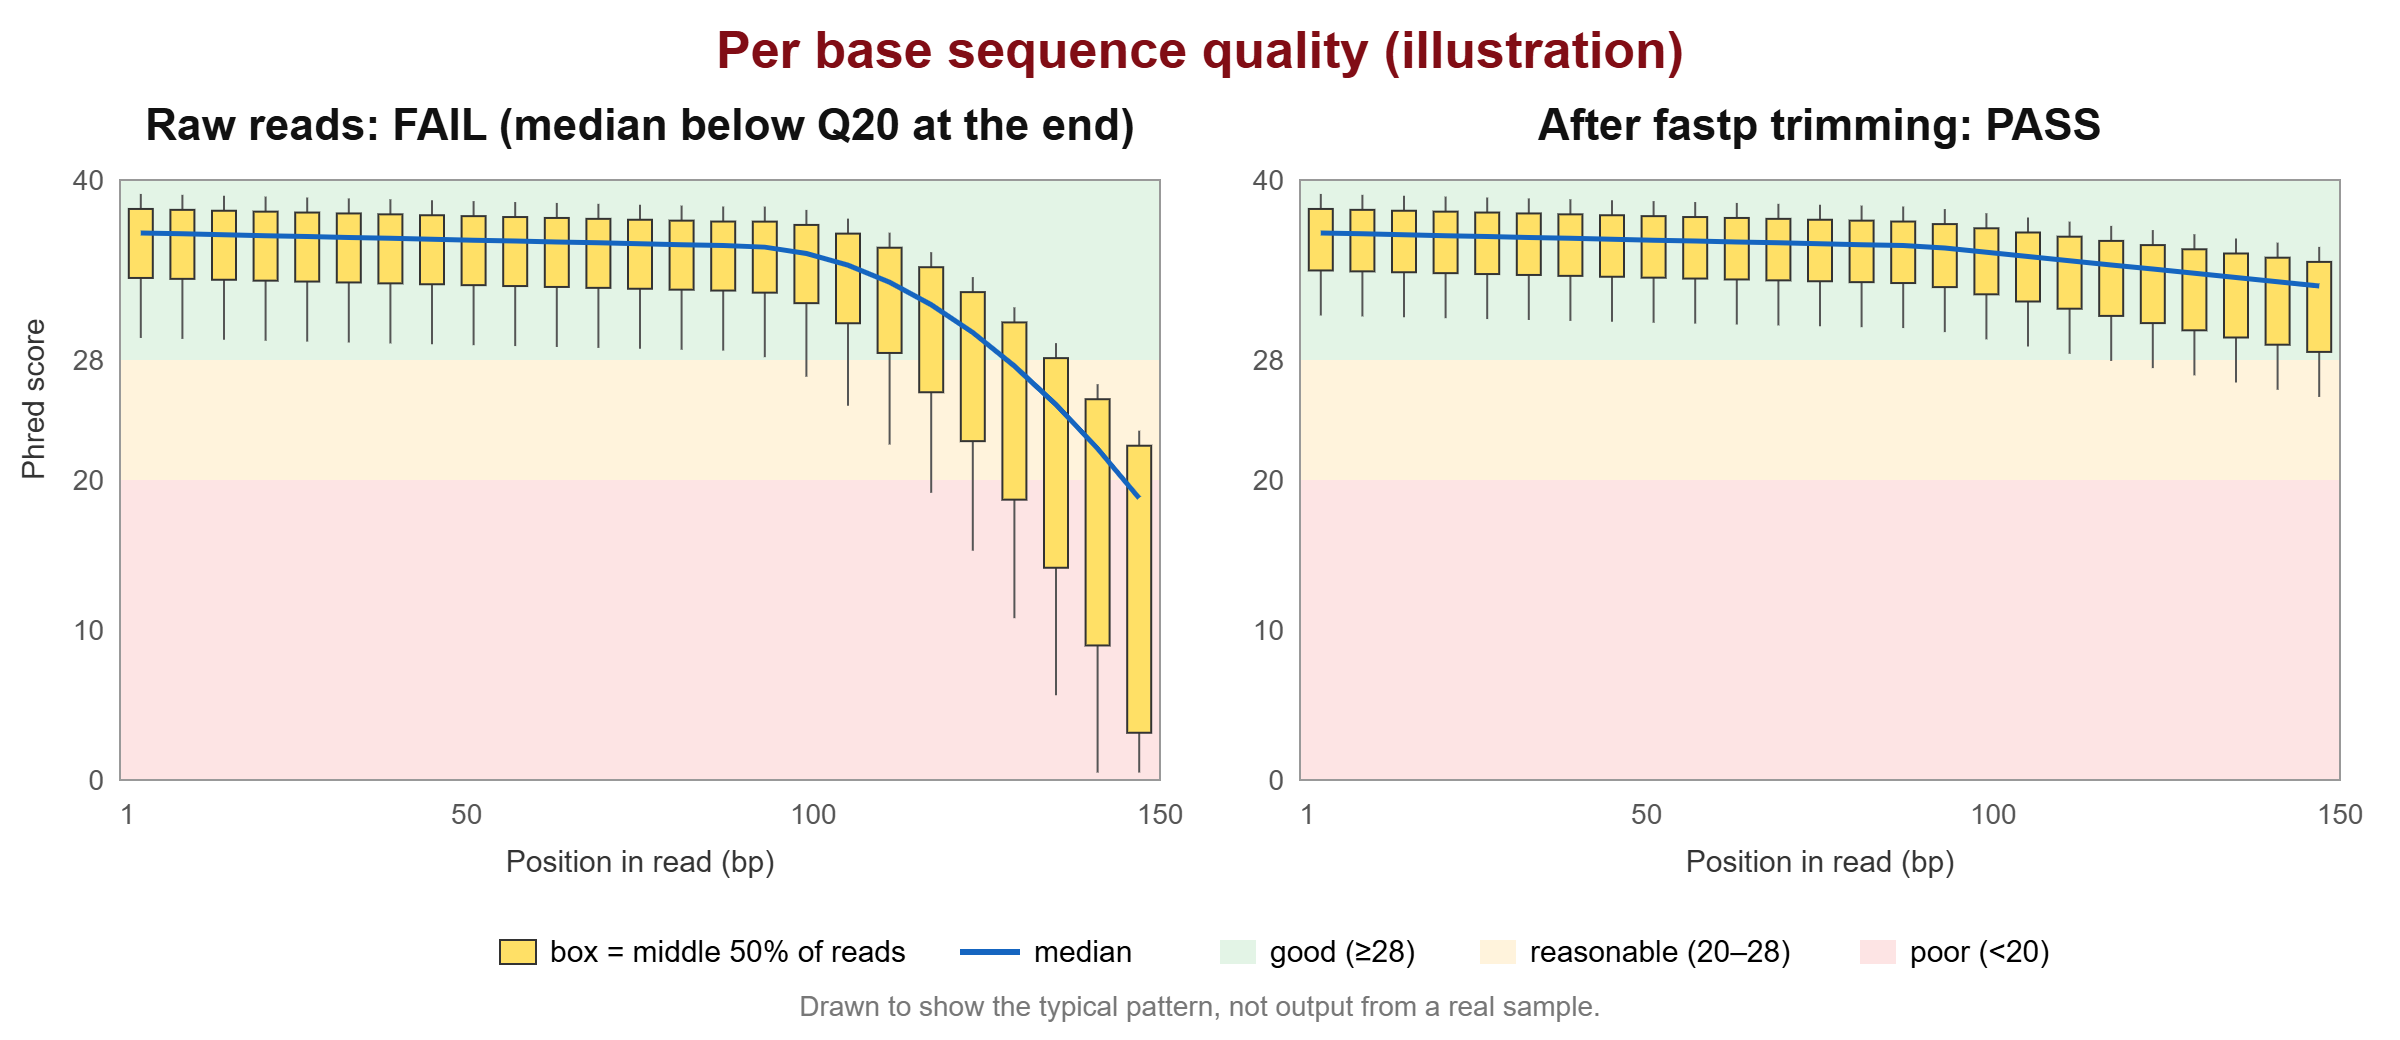
Open qc_raw/sample_R1_fastqc.html in your browser. Start with the per base sequence quality plot: a box for each position shows the spread of quality scores across all reads.
The thresholds behind the ticks and crosses are written for whole-genome DNA data. This table shows FastQC’s default rules and when a warning is normal:
| Module | Warns when | Fails when | Often normal for |
|---|---|---|---|
| Per base sequence quality | Lower quartile of any position below 10, or median below 25 | Lower quartile below 5, or median below 20 | Last few bases of long reads |
| Per base sequence content | A and T, or G and C, differ by more than 10% at any position | Difference more than 20% | First 10–12 bases of RNA-seq; amplicon and bisulfite data |
| Per sequence GC content | More than 15% of reads deviate from a normal distribution | More than 30% deviate | Bacteria-rich, mixed-species or targeted samples |
| Per base N content | N above 5% at any position | N above 20% | Rarely normal: check the run |
| Sequence length distribution | Reads are not all the same length | Any read has length zero | Every trimmed file |
| Sequence duplication levels | Less than 70% of reads would remain after deduplication (about 30% duplicates) | Less than 50% would remain (more than 50% duplicates) | RNA-seq, amplicon, small RNA, ChIP-seq |
| Overrepresented sequences | Any sequence above 0.1% of reads | Any sequence above 1% | Amplicon and small RNA libraries |
| Adapter content | Any adapter above 5% of reads | Above 10% | Small RNA (before trimming) |
How to read the key modules:
- Per base sequence quality: the most important plot. Most boxes should sit in the green zone (Q28 and above). A drop only in the last few bases is fine; medians below Q20 mean you should trim.
- Adapter content: a line that rises towards the 3′ end means adapter read-through (explained below). Trim it.
- Per sequence GC content: one smooth peak near your organism’s GC content (about 41% for human). A second peak or a shoulder often means contamination, for example bacteria or adapter dimers.
- Sequence duplication levels: in RNA-seq, highly expressed genes give many identical reads. A warning here is expected and should not be “fixed” by removing duplicates.
- Overrepresented sequences: check the “Possible source” column. Adapter or primer hits mean trimming; rRNA in RNA-seq means poor rRNA depletion, which trimming cannot fix.
▸ Go deeper: all FastQC modules, one by one
| Module | What it measures | How to act on it |
|---|---|---|
| Basic Statistics | Read count, length, %GC, quality encoding | Check the encoding and that the read count matches what the facility reported |
| Per base sequence quality | Quality distribution at each position | Trim if medians drop below Q20 |
| Per tile sequence quality | Quality loss of each flow-cell tile against the average | Report to the facility; filtering by tile is rarely needed |
| Per sequence quality scores | Distribution of mean quality per read | A second low-quality peak means a subset of bad reads; filter by average quality |
| Per base sequence content | Proportion of A, C, G, T at each position | Expected bias at the start of RNA-seq, ATAC-seq and amplicon reads |
| Per sequence GC content | GC distribution against a theoretical normal curve | Extra peaks suggest contamination or adapter dimers |
| Per base N content | Percentage of N calls per position | A spike at one cycle = an instrument problem |
| Sequence length distribution | Read lengths | Always warns after trimming; that is expected |
| Sequence duplication levels | How often identical sequences occur | Judge by library type; do not deduplicate RNA-seq reads |
| Overrepresented sequences | Sequences above 0.1% of reads, with a possible source | Adapters → trim; rRNA → library problem |
| Adapter content | Cumulative % of reads containing adapter k-mers by position | Trim adapters |
| Kmer content (off by default) | Position-biased short sequences | Use for detective work on unknown contaminants |
The per sequence quality module warns when the most common mean read quality is below 27 and fails below 20, in the configuration that ships with current FastQC releases.
🔬 Researcher notes: tune FastQC to your data type
FastQC’s default limits are written for whole-genome shotgun DNA. For other library types, write a limits file instead of ignoring red crosses every time. Entries you leave out keep their defaults.
# limits_rnaseq.txt — example for bulk RNA-seq
duplication	ignore	1
sequence	warn	20
sequence	error	30

# run with:
fastqc -l limits_rnaseq.txt -o qc_raw/ sample_R1.fastq.gz
A note on documentation: FastQC’s help page for the duplication module describes a warning at more than 20% non-unique sequences, while the shipped limits.txt warns when fewer than 70% of reads would remain after deduplication (about 30% duplicates). The configuration file is what the program actually uses; the table above follows it.
Expected results by data type
| Data type | Warnings you can usually accept | Warnings that need action |
|---|---|---|
| Whole-genome / exome DNA | Slight quality drop at the end | Adapter content, GC with two peaks, high N |
| Bulk RNA-seq | Duplication, base content in first 10–12 bases | Low quality, adapters, rRNA in overrepresented |
| 16S / amplicon | Duplication, overrepresented sequences, base content | Low quality at read ends before merging |
| Small RNA / miRNA | Adapter content before trimming, length distribution after | Adapters still present after trimming |
| Bisulfite sequencing | Very low C (or G) in base content | Low quality, adapters |
🔬 Researcher notes: library-specific artefacts you will meet
- ATAC-seq: the Tn5 transposase has a sequence preference, so the first bases of every read show biased composition. This is biology of the assay, not a fault.
- Amplicon and 16S: every read starts with the same primer, so base composition is extremely unbalanced. Facilities add a PhiX control library to keep the run diverse; expect some PhiX reads and very high duplication.
- Bisulfite sequencing: unmethylated C is converted to T, so C almost disappears from read 1 (and G from read 2). GC content looks very low.
- Small RNA: inserts are about 18–30 nt, so nearly every 50+ bp read contains adapter. Adapter trimming is essential, and the length distribution after trimming is your key QC plot.
- Single-cell (10x Genomics 3′): read 1 holds the cell barcode and UMI, not cDNA. Run QC on read 2 for biological sequence quality; read 1 base composition is meaningless.