Every cell in your body carries roughly the same DNA, yet a neuron, a muscle cell and a white blood cell behave completely differently. The difference lies in which genes each cell switches on, and how strongly. The moment a gene is switched on, the cell copies it into RNA. Read all of those RNA copies at once and you get a live snapshot of what the cell is doing.
So what is transcriptomics, and how did bioinformatics change it? In simple words, transcriptomics is the study of all the RNA molecules, called transcripts, in a cell, tissue or organism at a given moment. It tells you which genes are active, how active they are, and which versions of each gene are being used. A modern RNA-seq experiment produces tens of millions of short reads per sample, and turning those reads into a list of genes that changed is entirely a computational job.
In this article you will learn what transcriptomics is and how it fits between genomics and proteomics, how the field moved from microarrays to RNA-seq, single-cell and spatial methods, the specific ways bioinformatics altered each step of RNA analysis, a real case where flawed gene-expression analysis reached cancer patients, what is happening in India, which skills and courses lead to a career, and what transcriptomics still cannot tell you.
What Is Transcriptomics? A Simple Definition
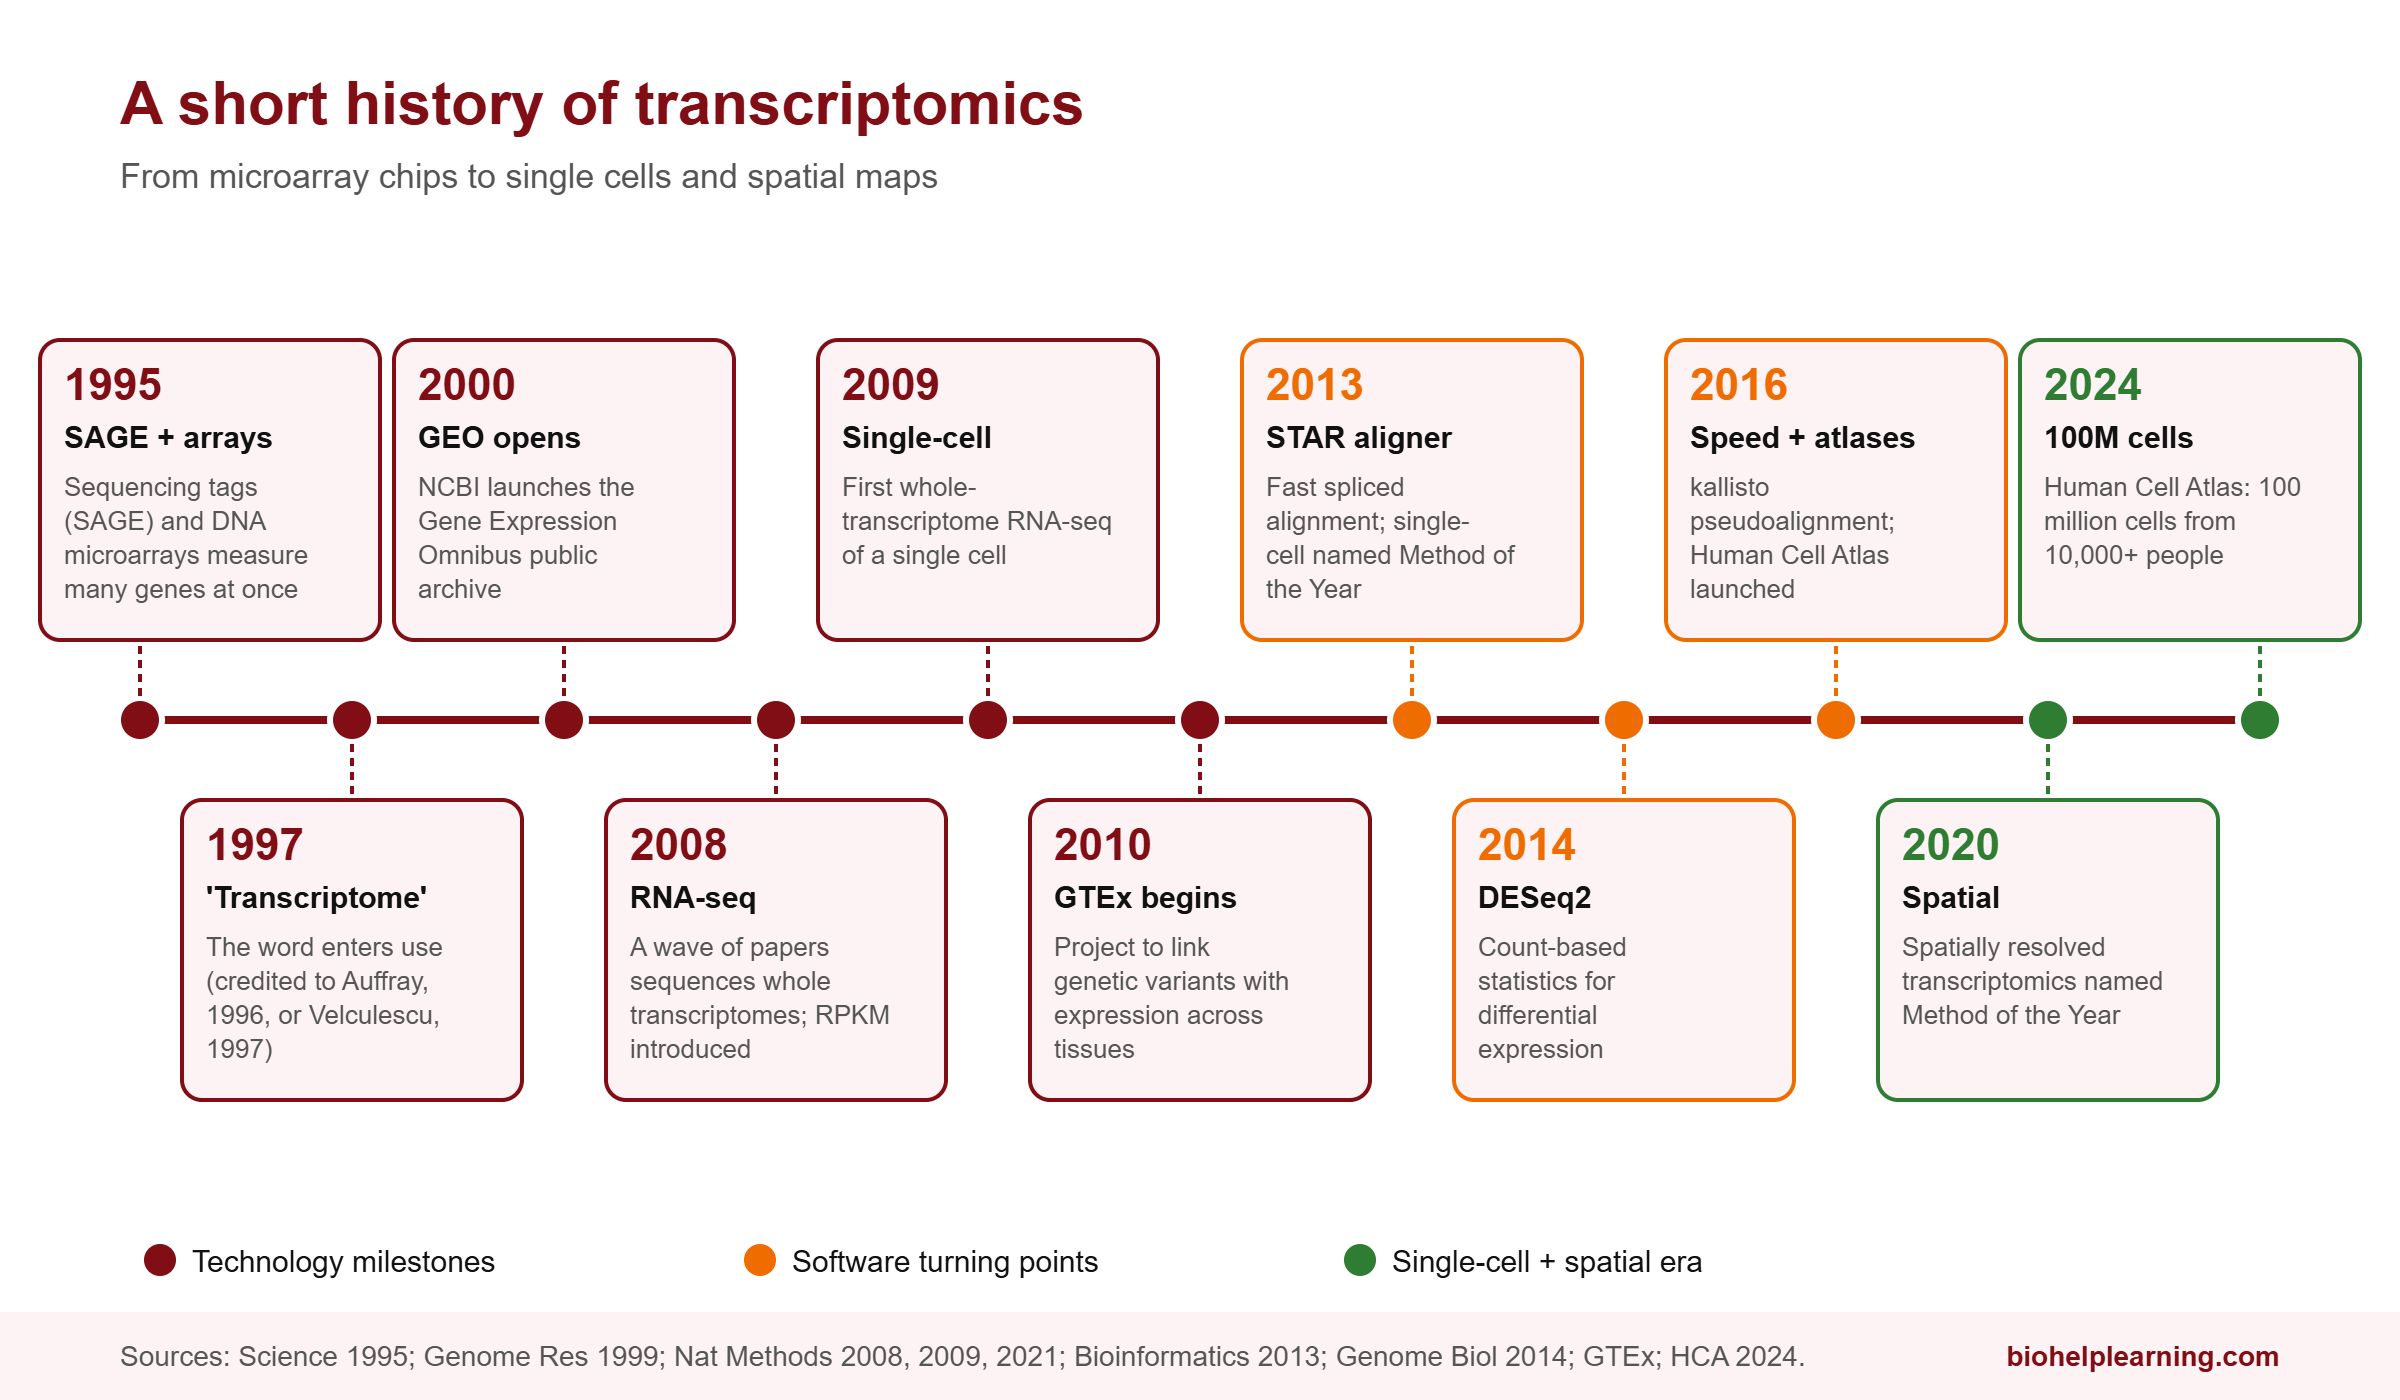
The transcriptome is the complete set of RNA transcripts in a cell or group of cells. The word blends “transcript” and “genome”. Its origin is slightly disputed. Charles Auffray and colleagues wrote that Auffray coined the term in 1996 to describe entire sets of transcripts, while Victor Velculescu and colleagues used it in a 1997 paper describing gene expression in yeast, and some sources credit Velculescu. Either way, the word appeared in the mid-1990s, just as technology made it possible to measure thousands of genes at once. Transcriptomics is the study of the transcriptome.
Like the proteome, the transcriptome is not fixed. It changes with cell type, developmental stage, time of day, disease and treatment. A transcriptome is therefore always a snapshot of particular conditions, which is exactly what makes it useful.
Where transcriptomics sits: genomics, transcriptomics, proteomics
Think of the flow of genetic information. DNA is the master copy; genomics studies it. RNA is the working copy made when a gene is switched on; transcriptomics studies it. Proteins are the machines built from RNA instructions; proteomics studies them. RNA is far easier and cheaper to measure at scale than protein, which is why transcriptomics is often the first “functional” experiment researchers run. For the neighbouring fields, see our companion articles on what genomics is and what proteomics is.
One caution: RNA level is not protein level. In a 2012 review in Nature Reviews Genetics, Christine Vogel and Edward Marcotte noted that in mammalian cells only about 30–40% of the variation in protein abundance was explained by mRNA abundance in large studies. Later reanalyses that corrected for measurement noise argued the true figure is considerably higher, so the exact number is still debated. The safe takeaway is that RNA is a strong clue to protein activity, but not a perfect substitute.
Main branches of transcriptomics
- Bulk RNA-seq: measures the average expression of all cells in a sample, such as a tumour biopsy.
- Single-cell RNA-seq (scRNA-seq): measures expression in thousands of individual cells, revealing cell types and states hidden in bulk averages.
- Spatial transcriptomics: measures expression while keeping track of where each cell or spot sits in a tissue section.
- Small RNA sequencing: focuses on microRNAs and other short regulatory RNAs.
- Long-read transcriptomics: reads full-length transcripts to identify exactly which splice isoforms are present.
- Metatranscriptomics: sequences RNA from whole microbial communities to see which genes the microbes are actually using.
From ESTs and Microarrays to RNA-seq
Measuring gene expression used to mean studying one gene at a time with Northern blots or, later, quantitative PCR. In the 1990s, researchers began sequencing short fragments of expressed genes, called expressed sequence tags (ESTs). In 1995, Velculescu, Bert Vogelstein, Kenneth Kinzler and colleagues described SAGE (serial analysis of gene expression), one of the earliest sequencing-based methods for measuring expression genome-wide.
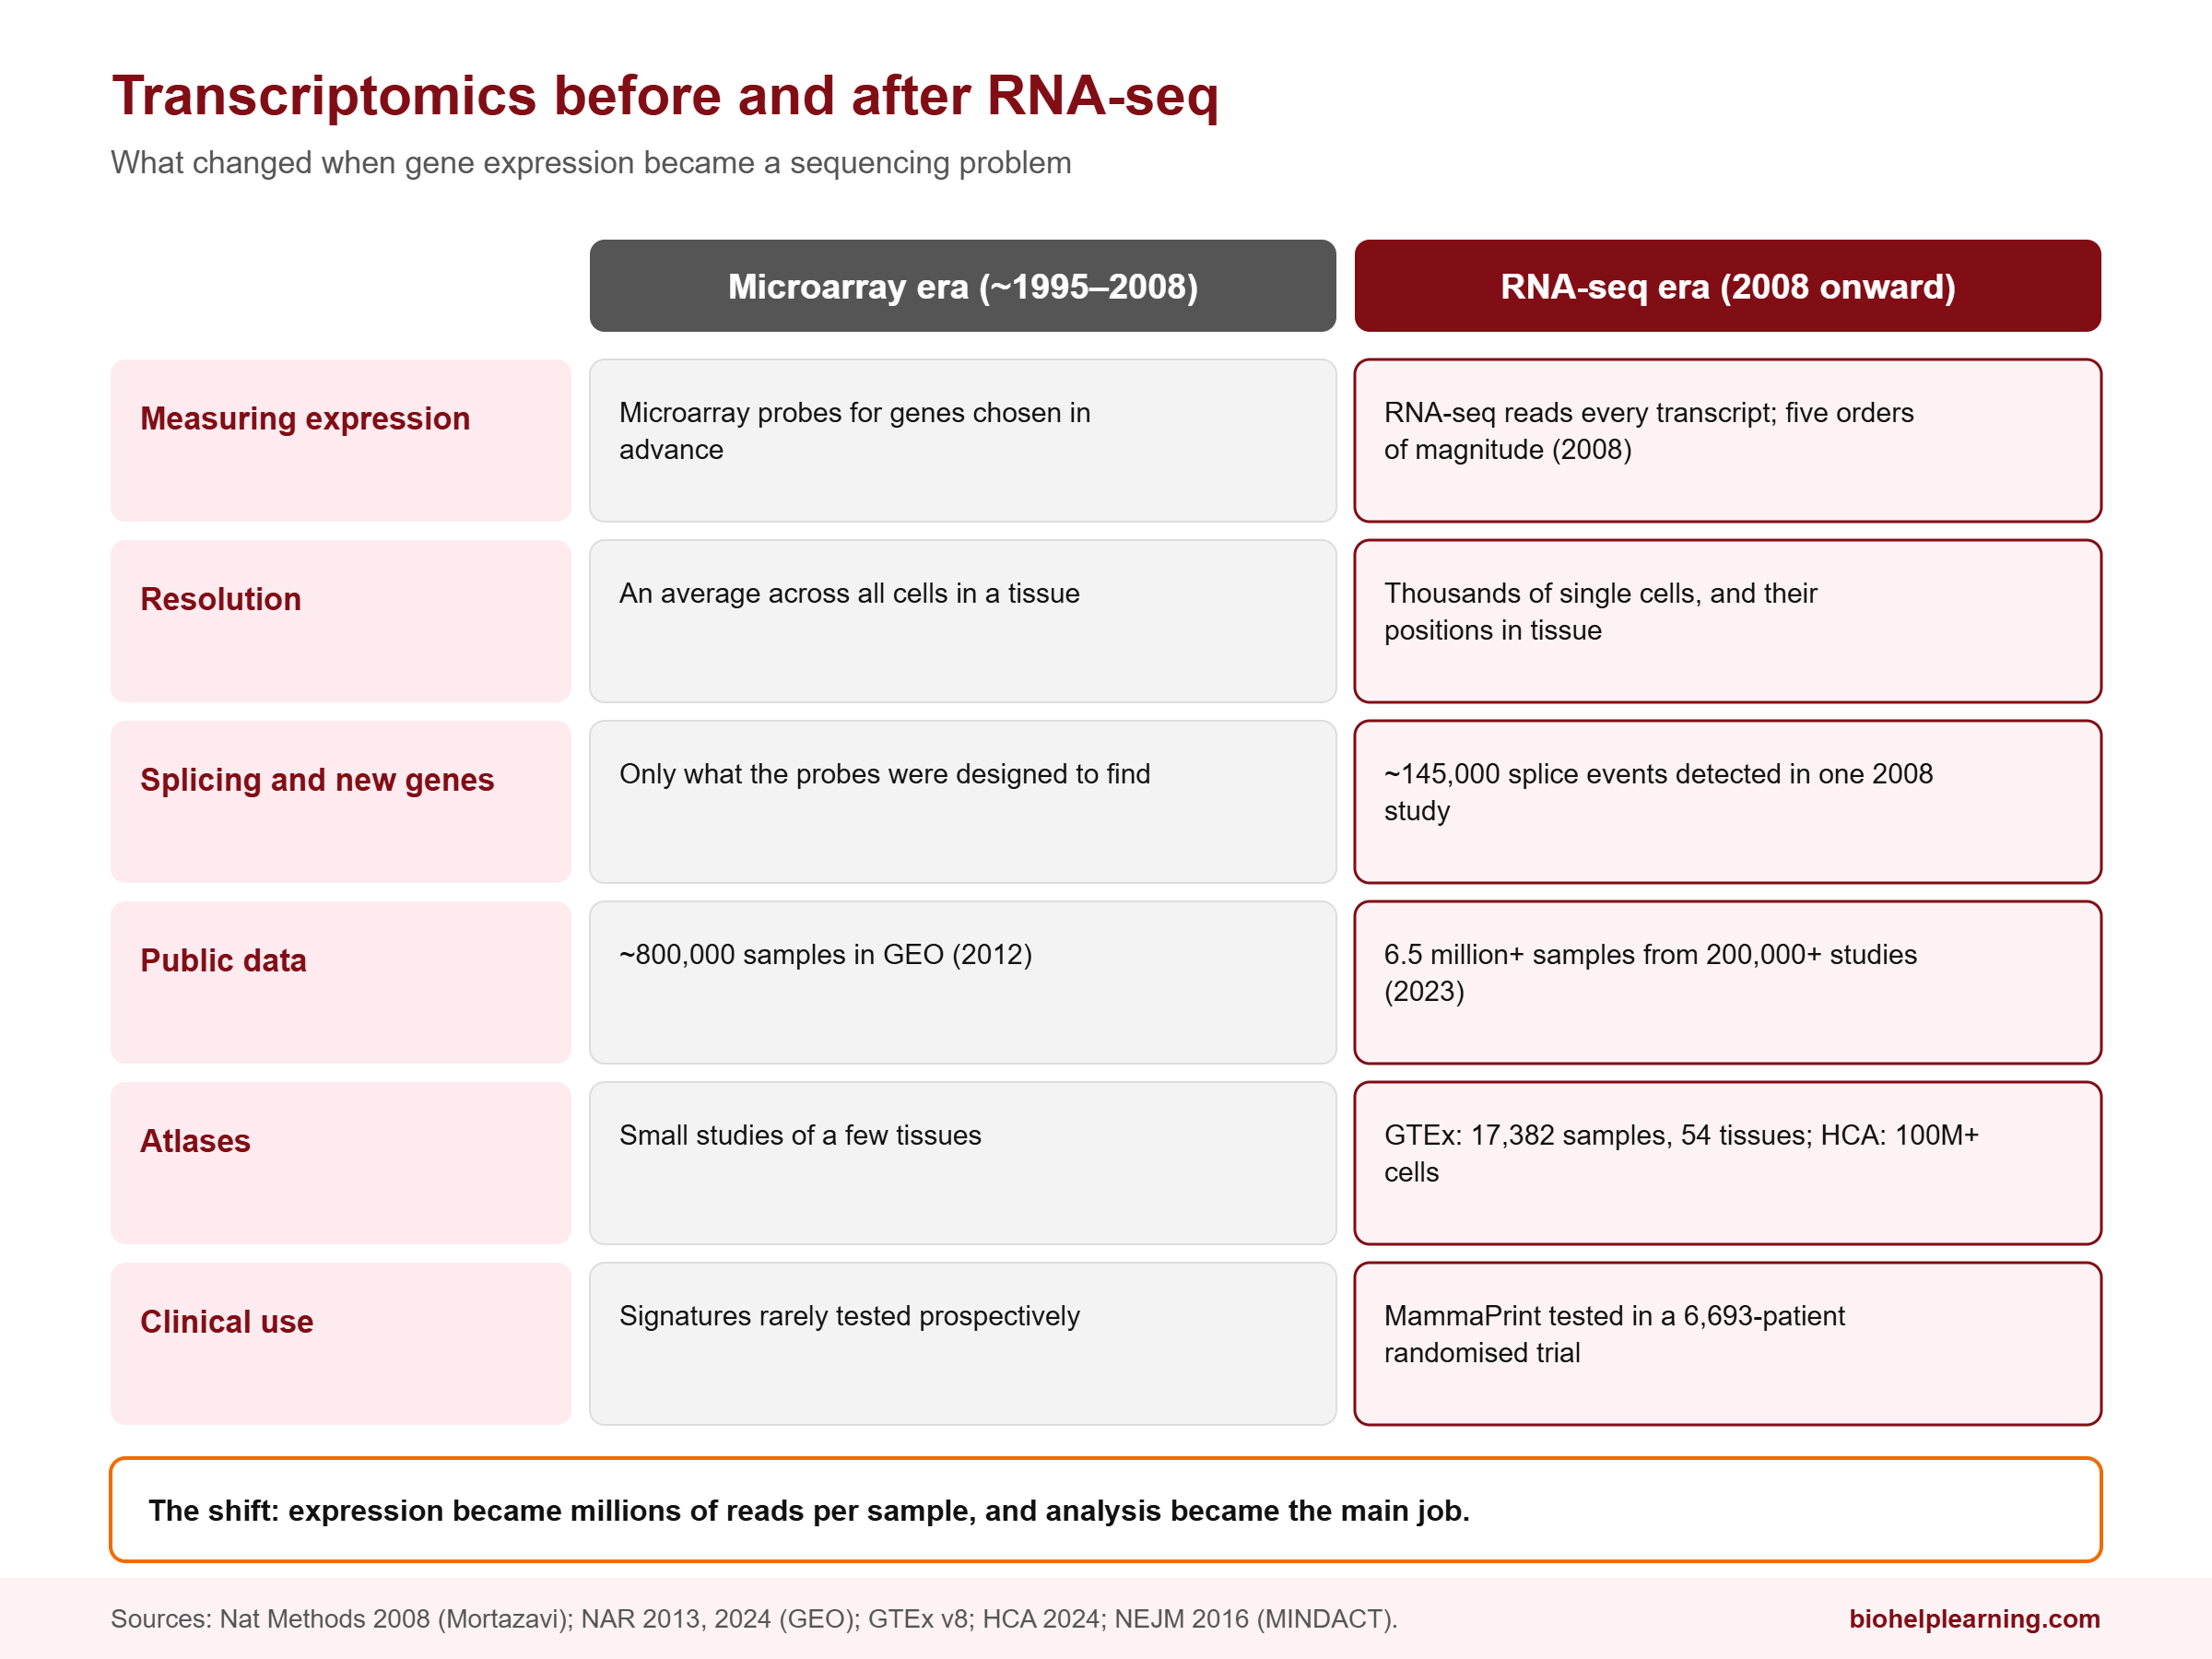
The same period saw the rise of DNA microarrays: glass slides or chips carrying thousands of DNA probes, each designed to catch RNA from one gene. Microarrays dominated gene-expression research through the 2000s. But they had real limits. They struggled to detect genes expressed at very low levels, and they could confuse genes with similar sequences. They also only measured what their probes were designed to find.
Then, in May 2008, a burst of papers introduced RNA-seq. One of the most influential, by Ali Mortazavi, Barbara Wold and colleagues at Caltech, sequenced RNA from mouse brain, liver and skeletal muscle using 41–52 million mapped 25-base reads per sample. The method measured transcripts across five orders of magnitude, detected about 145,000 distinct splice events, and found 3,500 genes expressing alternative internal splices. The paper also introduced RPKM, a way of normalising read counts by gene length and sequencing depth. A commentary in the same journal issue was titled “The beginning of the end for microarrays?”
RNA-seq changed the nature of the problem. Instead of reading a fluorescent signal from a fixed set of probes, researchers now had tens of millions of short sequences per sample that had to be placed back on the genome, counted and compared. That is a bioinformatics problem from start to finish. If you want to understand the older technology, our guide to microarray technology explains how it works and where it falls short.
The Data Explosion in Gene Expression
The Gene Expression Omnibus (GEO) at the US National Center for Biotechnology Information (NCBI), set up in 2000, shows how quickly the data grew. In 2012, GEO held about 800,000 samples. By its 2023 update, it held more than 6.5 million samples from over 200,000 studies, with the number of studies growing about 15% a year. In 2022, 21% of the RNA-seq studies GEO released were single-cell experiments.
Raw RNA-seq reads must be heavily processed before anyone can interpret them. GEO itself now runs a standard pipeline that aligns public human and mouse RNA-seq data with the HISAT2 aligner and counts reads per gene with featureCounts, so researchers can download ready-made count tables. That is a sign of how central computation has become: even the database does bioinformatics for you.
How Bioinformatics Altered the Field of Transcriptomics
Here are the specific shifts, step by step.
1. Spliced alignment: putting reads back where they came from
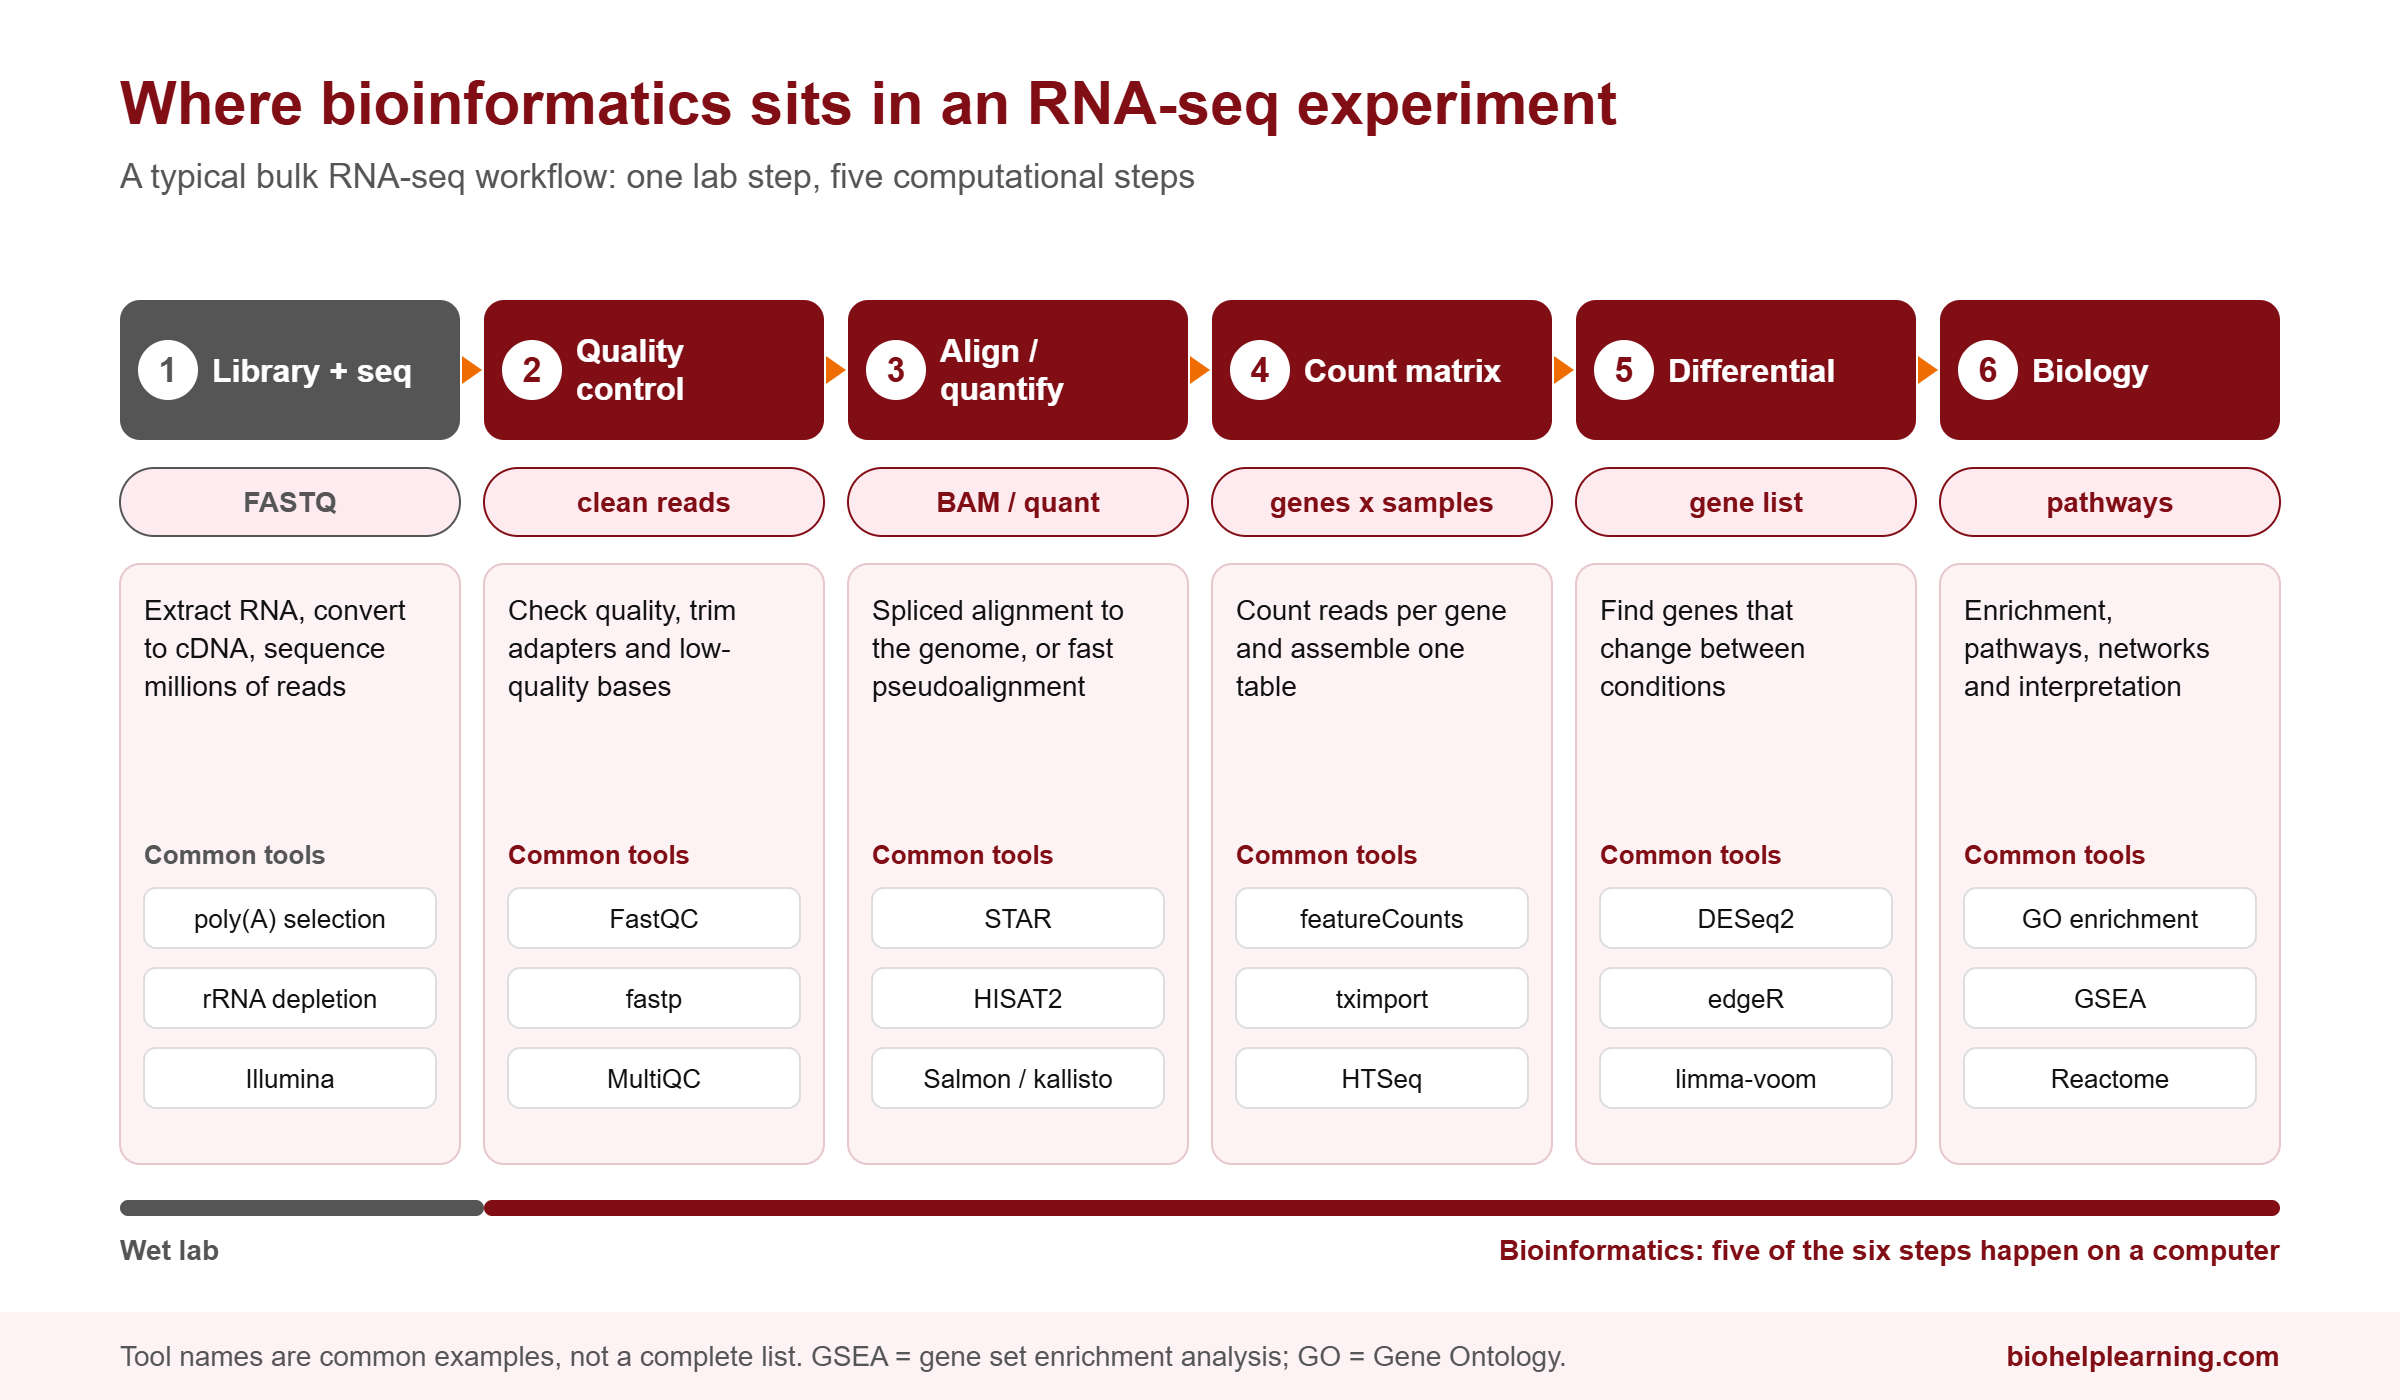
RNA reads are harder to align than DNA reads because introns have been spliced out. A single read can span two exons that sit thousands of bases apart in the genome. Specialised “spliced aligners” were built for this. STAR, published by Alexander Dobin and colleagues in 2013, became one of the most widely used because of its speed, along with tools such as TopHat2 and HISAT2.
2. Quantification without full alignment
Counting how many reads come from each transcript sounds simple, but many reads match several related transcripts. In 2016, kallisto (Nicolas Bray, Lior Pachter and colleagues) introduced “pseudoalignment”, and in 2017 Salmon (Rob Patro and colleagues) offered fast, bias-aware quantification. These tools are substantially faster and use less memory than full alignment, so a laptop can now quantify an experiment that once needed a server. The tximport package then converts their output into gene-level tables for statistical analysis.
3. Statistics for differential expression
The real question in most experiments is: which genes changed between conditions? RNA-seq counts are discrete, noisy, and usually come from only three or four replicates per group. Ordinary t-tests fail here. Bioinformaticians developed count-based models instead. DESeq2, published by Michael Love, Wolfgang Huber and Simon Anders in 2014, uses negative binomial models and “shrinks” unreliable estimates of variability and fold change to make results more stable. Along with edgeR and limma-voom, it is one of the standard tools taught in almost every RNA-seq course. Choosing the right statistical model is often more important than choosing the right sequencer.
4. Single-cell transcriptomics
In 2009, Fuchou Tang, Azim Surani and colleagues published the first whole-transcriptome RNA-seq of a single cell, a mouse blastomere, detecting 75% more genes than microarrays. By 2013, Nature Methods named single-cell sequencing its Method of the Year.
Single-cell data is a different kind of computational challenge. Each experiment can contain tens of thousands of cells, each measured for thousands of genes, with many zeros. Analysts must filter low-quality cells, normalise, remove batch effects, reduce dimensions with methods like UMAP, cluster cells and then work out which cell type each cluster represents. Tools such as Seurat (R) and Scanpy (Python) were built for exactly this.
The flagship project is the Human Cell Atlas, launched in 2016. By November 2024, more than 3,600 members from over 100 countries had profiled more than 100 million cells from over 10,000 people, and the consortium is assembling a first draft atlas. Integrating data from hundreds of labs into one coherent reference is mainly a computational achievement.
5. Spatial transcriptomics
Single-cell methods dissociate tissue, so they lose information about where each cell was. Spatial transcriptomics keeps that context. Nature Methods named spatially resolved transcriptomics its Method of the Year for 2020. One widely used approach began in Sweden as a project led by graduate students Patrik Ståhl and Fredrik Salmén, was first published in Science in 2016, and was commercialised through a spinout bought by 10x Genomics in 2018, becoming the Visium platform. Spatial experiments can produce terabyte-scale datasets, and researchers have highlighted the need for machine learning to analyse them.
6. Tissue atlases and genetic regulation
The Genotype-Tissue Expression (GTEx) project, launched in 2010, combined RNA-seq with whole-genome sequencing to study how genetic variants affect gene expression across the body. Its final v8 analysis covered 17,382 RNA-seq samples from 54 tissues of 948 post-mortem donors, each sequenced to a median depth of 82.6 million reads. Linking millions of genetic variants to expression in dozens of tissues is a massive statistical exercise, and GTEx results are now a standard resource for interpreting disease genetics.
7. From signatures to the clinic
Gene-expression signatures have reached real patients. MammaPrint measures the expression of 70 genes in a breast tumour to estimate the risk of recurrence. The MINDACT trial, published in the New England Journal of Medicine in 2016, enrolled 6,693 women with early-stage breast cancer at 112 centres in nine European countries. Among women at high clinical risk but low genomic risk, skipping chemotherapy led to a five-year rate of survival without distant metastasis that was 1.5 percentage points lower than with chemotherapy. The researchers concluded that about 46% of women at high clinical risk might not need chemotherapy. That is transcriptomics changing treatment decisions, backed by a large randomised trial.
Case Study: The Duke Genomic Signatures
MammaPrint shows what a properly validated expression signature can do. The Duke University case shows what happens when the bioinformatics goes wrong. It is one of the most important lessons in the history of the field.
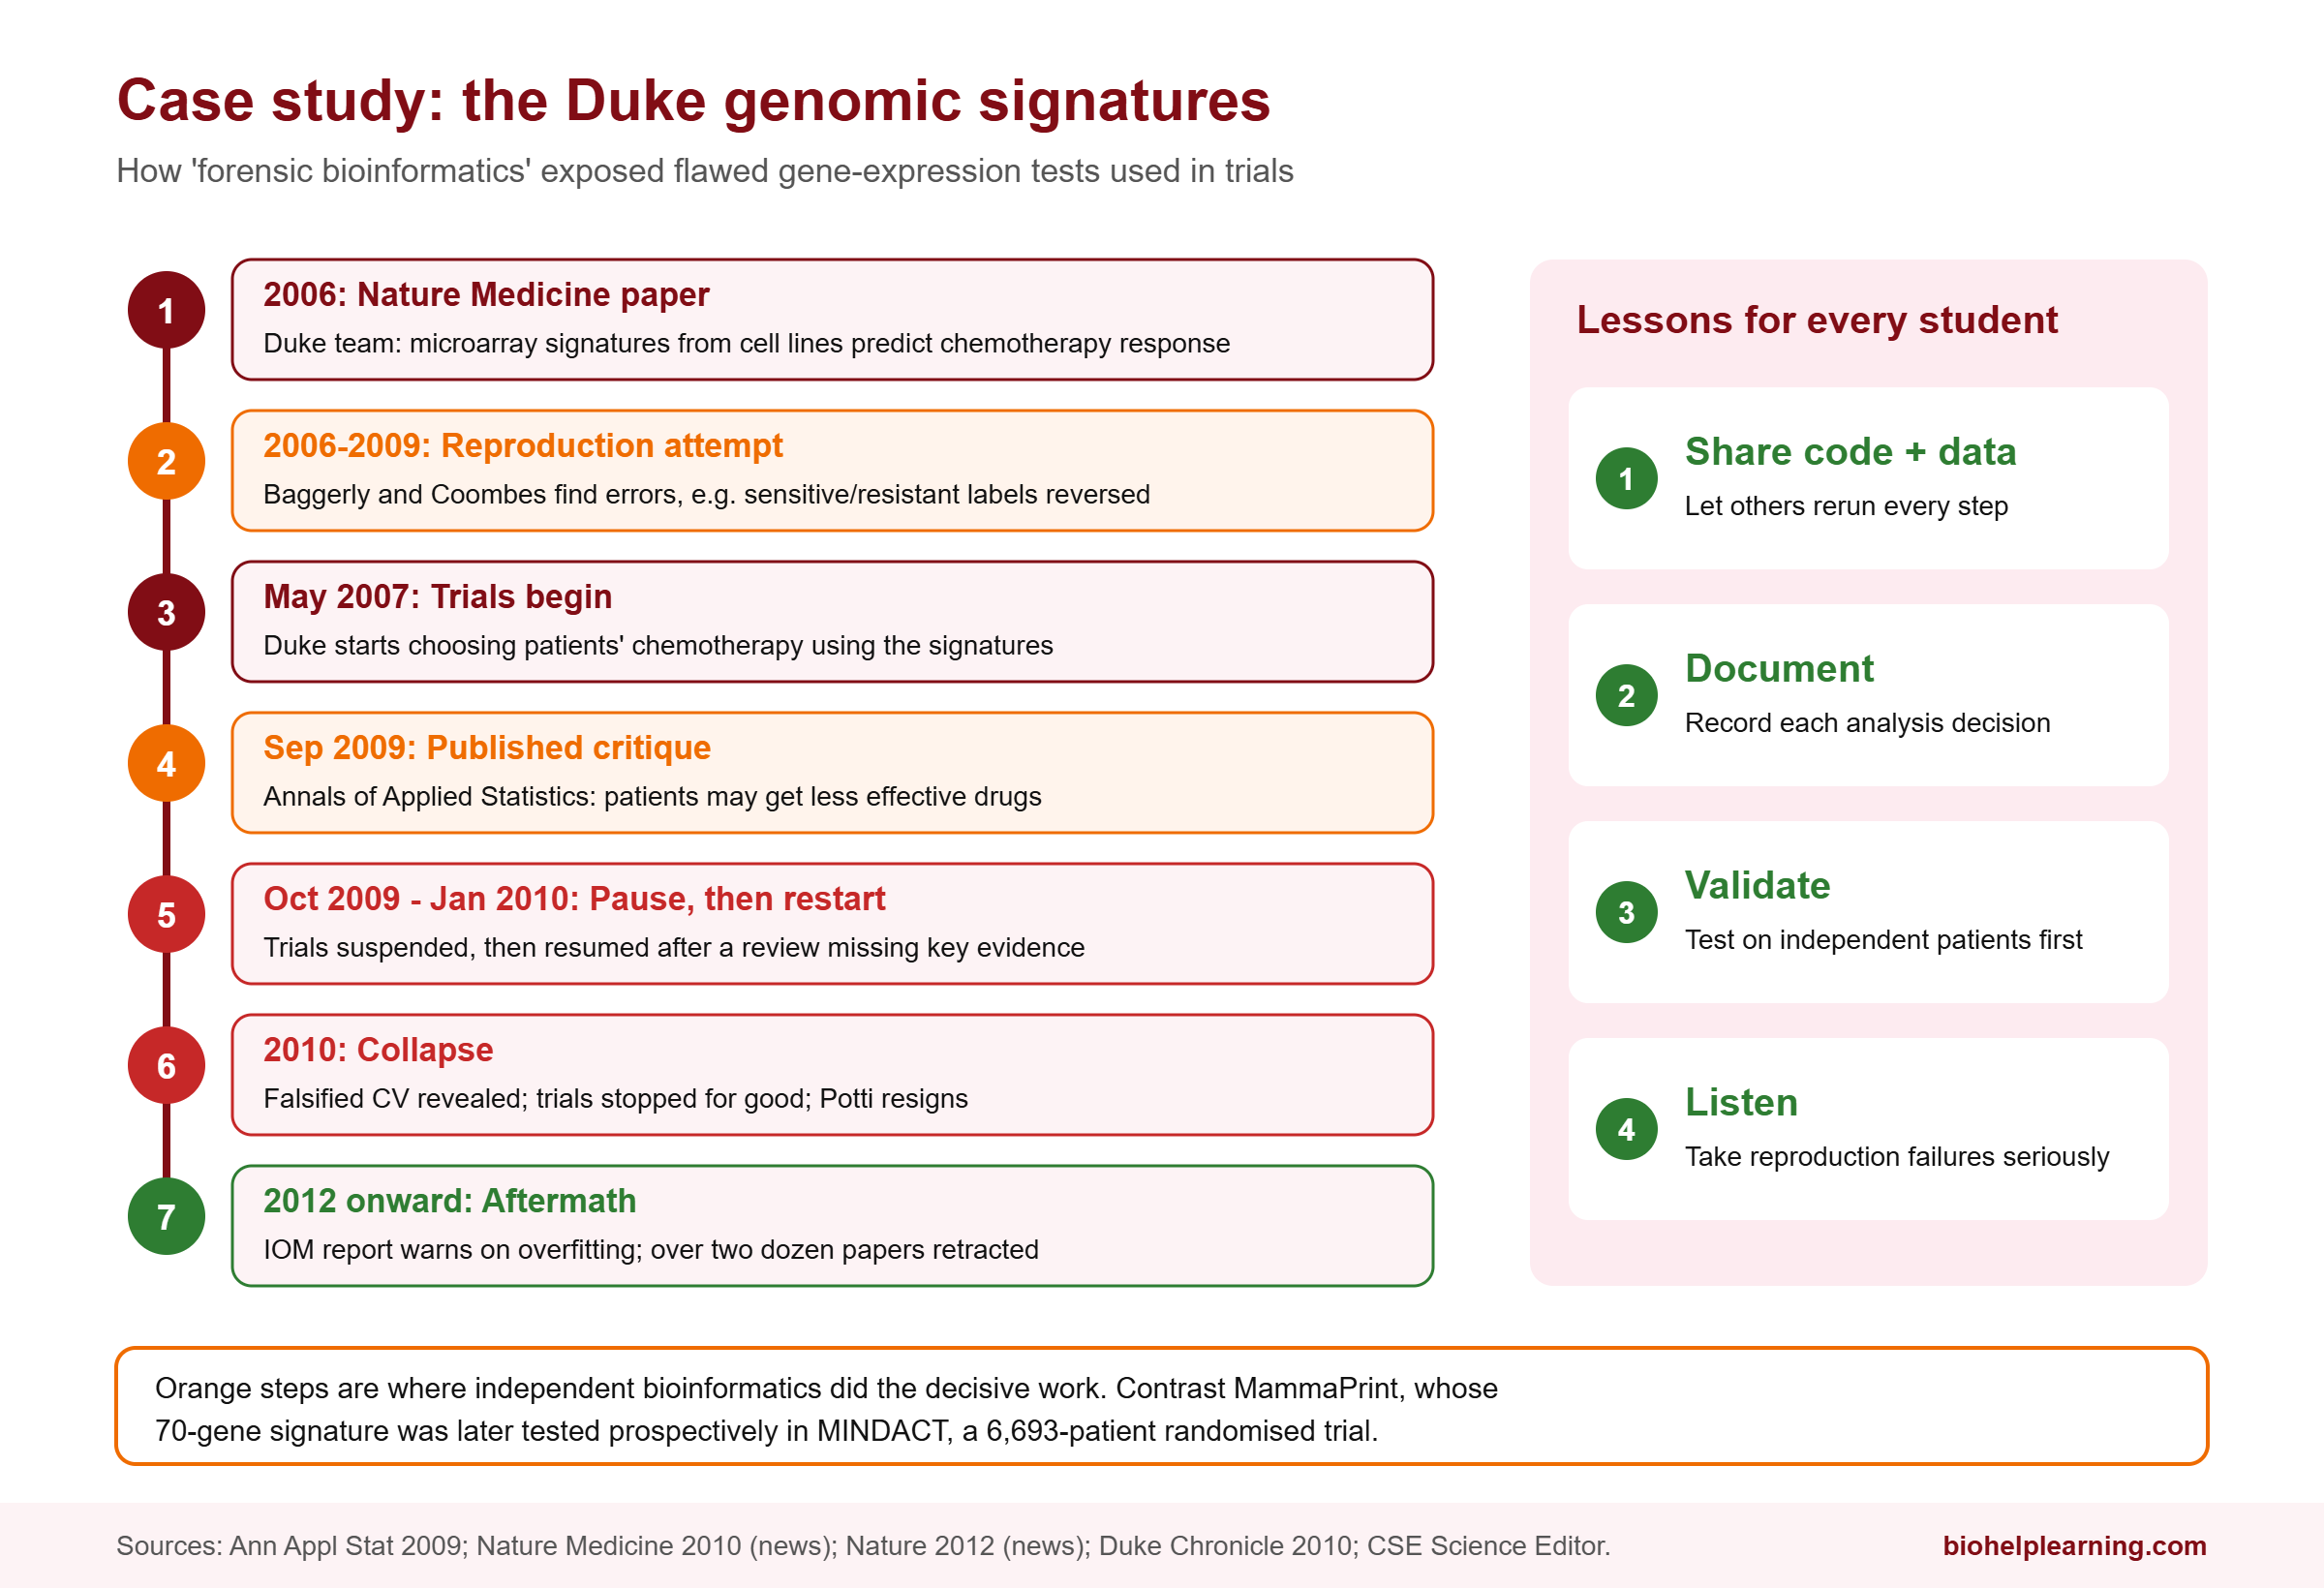
In 2006, a Duke team led by Anil Potti and Joseph Nevins published a paper in Nature Medicine describing gene-expression “signatures” built from microarray data on a panel of cancer cell lines, known as NCI-60. The signatures claimed to predict which chemotherapy drug would work best for an individual patient. It looked like a breakthrough in personalised medicine, and doctors at the M.D. Anderson Cancer Center in Texas wanted to use the approach too.
They asked two biostatisticians, Keith Baggerly and Kevin Coombes, to help reproduce it. Baggerly and Coombes found the published methods too vague to replicate, and when they reconstructed the analysis, they found serious errors. In several papers, for example, the labels marking cell lines as sensitive or resistant to a drug had been reversed. They called this painstaking reconstruction work “forensic bioinformatics”.
Meanwhile, clinical trials using the signatures to choose patients’ chemotherapy had begun at Duke in May 2007. When Baggerly and Coombes learned this in 2009, they published their objections in the Annals of Applied Statistics that September. They warned that some patients might be getting treatments their own reanalysis suggested would be less effective. Duke suspended three trials in October 2009, but restarted them in January 2010 after an internal review. It was later revealed that the external reviewers had never been shown a further report from Baggerly’s group sent in November 2009.
In mid-2010, it emerged that Potti had falsified parts of his CV, including a claim to have been a Rhodes Scholar. The trials were stopped for good, and Potti resigned from Duke that year. More than two dozen papers were eventually retracted, patients sued, and a misconduct investigation followed. In 2012, the US Institute of Medicine issued a report on omics-based tests that warned specifically about “overfitting”, where a computational model seems to link a gene signature with an outcome even though no real link exists.
The lesson for every student is concrete. Share your code and data. Document every step so others can reproduce it. Validate a signature on fully independent patients before it touches a treatment decision. And take seriously the colleague who says, “I can’t reproduce your result.”
What Is Transcriptomics Doing in India Today?
Indian institutions are building capacity in the newest transcriptomics methods. In December 2025, CSIR-Institute of Genomics and Integrative Biology (IGIB) in Delhi and BD Biosciences inaugurated a Centre of Excellence for Single-Cell Multiomics, intended as a hub for training, application support and collaboration.
Training has also grown. In January 2022, the National Institute of Biomedical Genomics (NIBMG) in Kalyani and MIT jointly ran an online international workshop on single-cell transcriptomics, supported by the Human Cell Atlas, covering everything from sample preparation to clustering, UMAP and data integration. The Institute of Bioinformatics and Applied Biotechnology (IBAB) in Bengaluru runs hands-on single-cell library preparation and data analysis workshops, and facilities such as the Next Generation Genomics Facility at NCBS and C-CAMP in Bengaluru have run bulk RNA-seq training.
For a wider view of where bioinformaticians work in the country, see our guide to top bioinformatics companies in India.
Careers in Transcriptomics and Bioinformatics
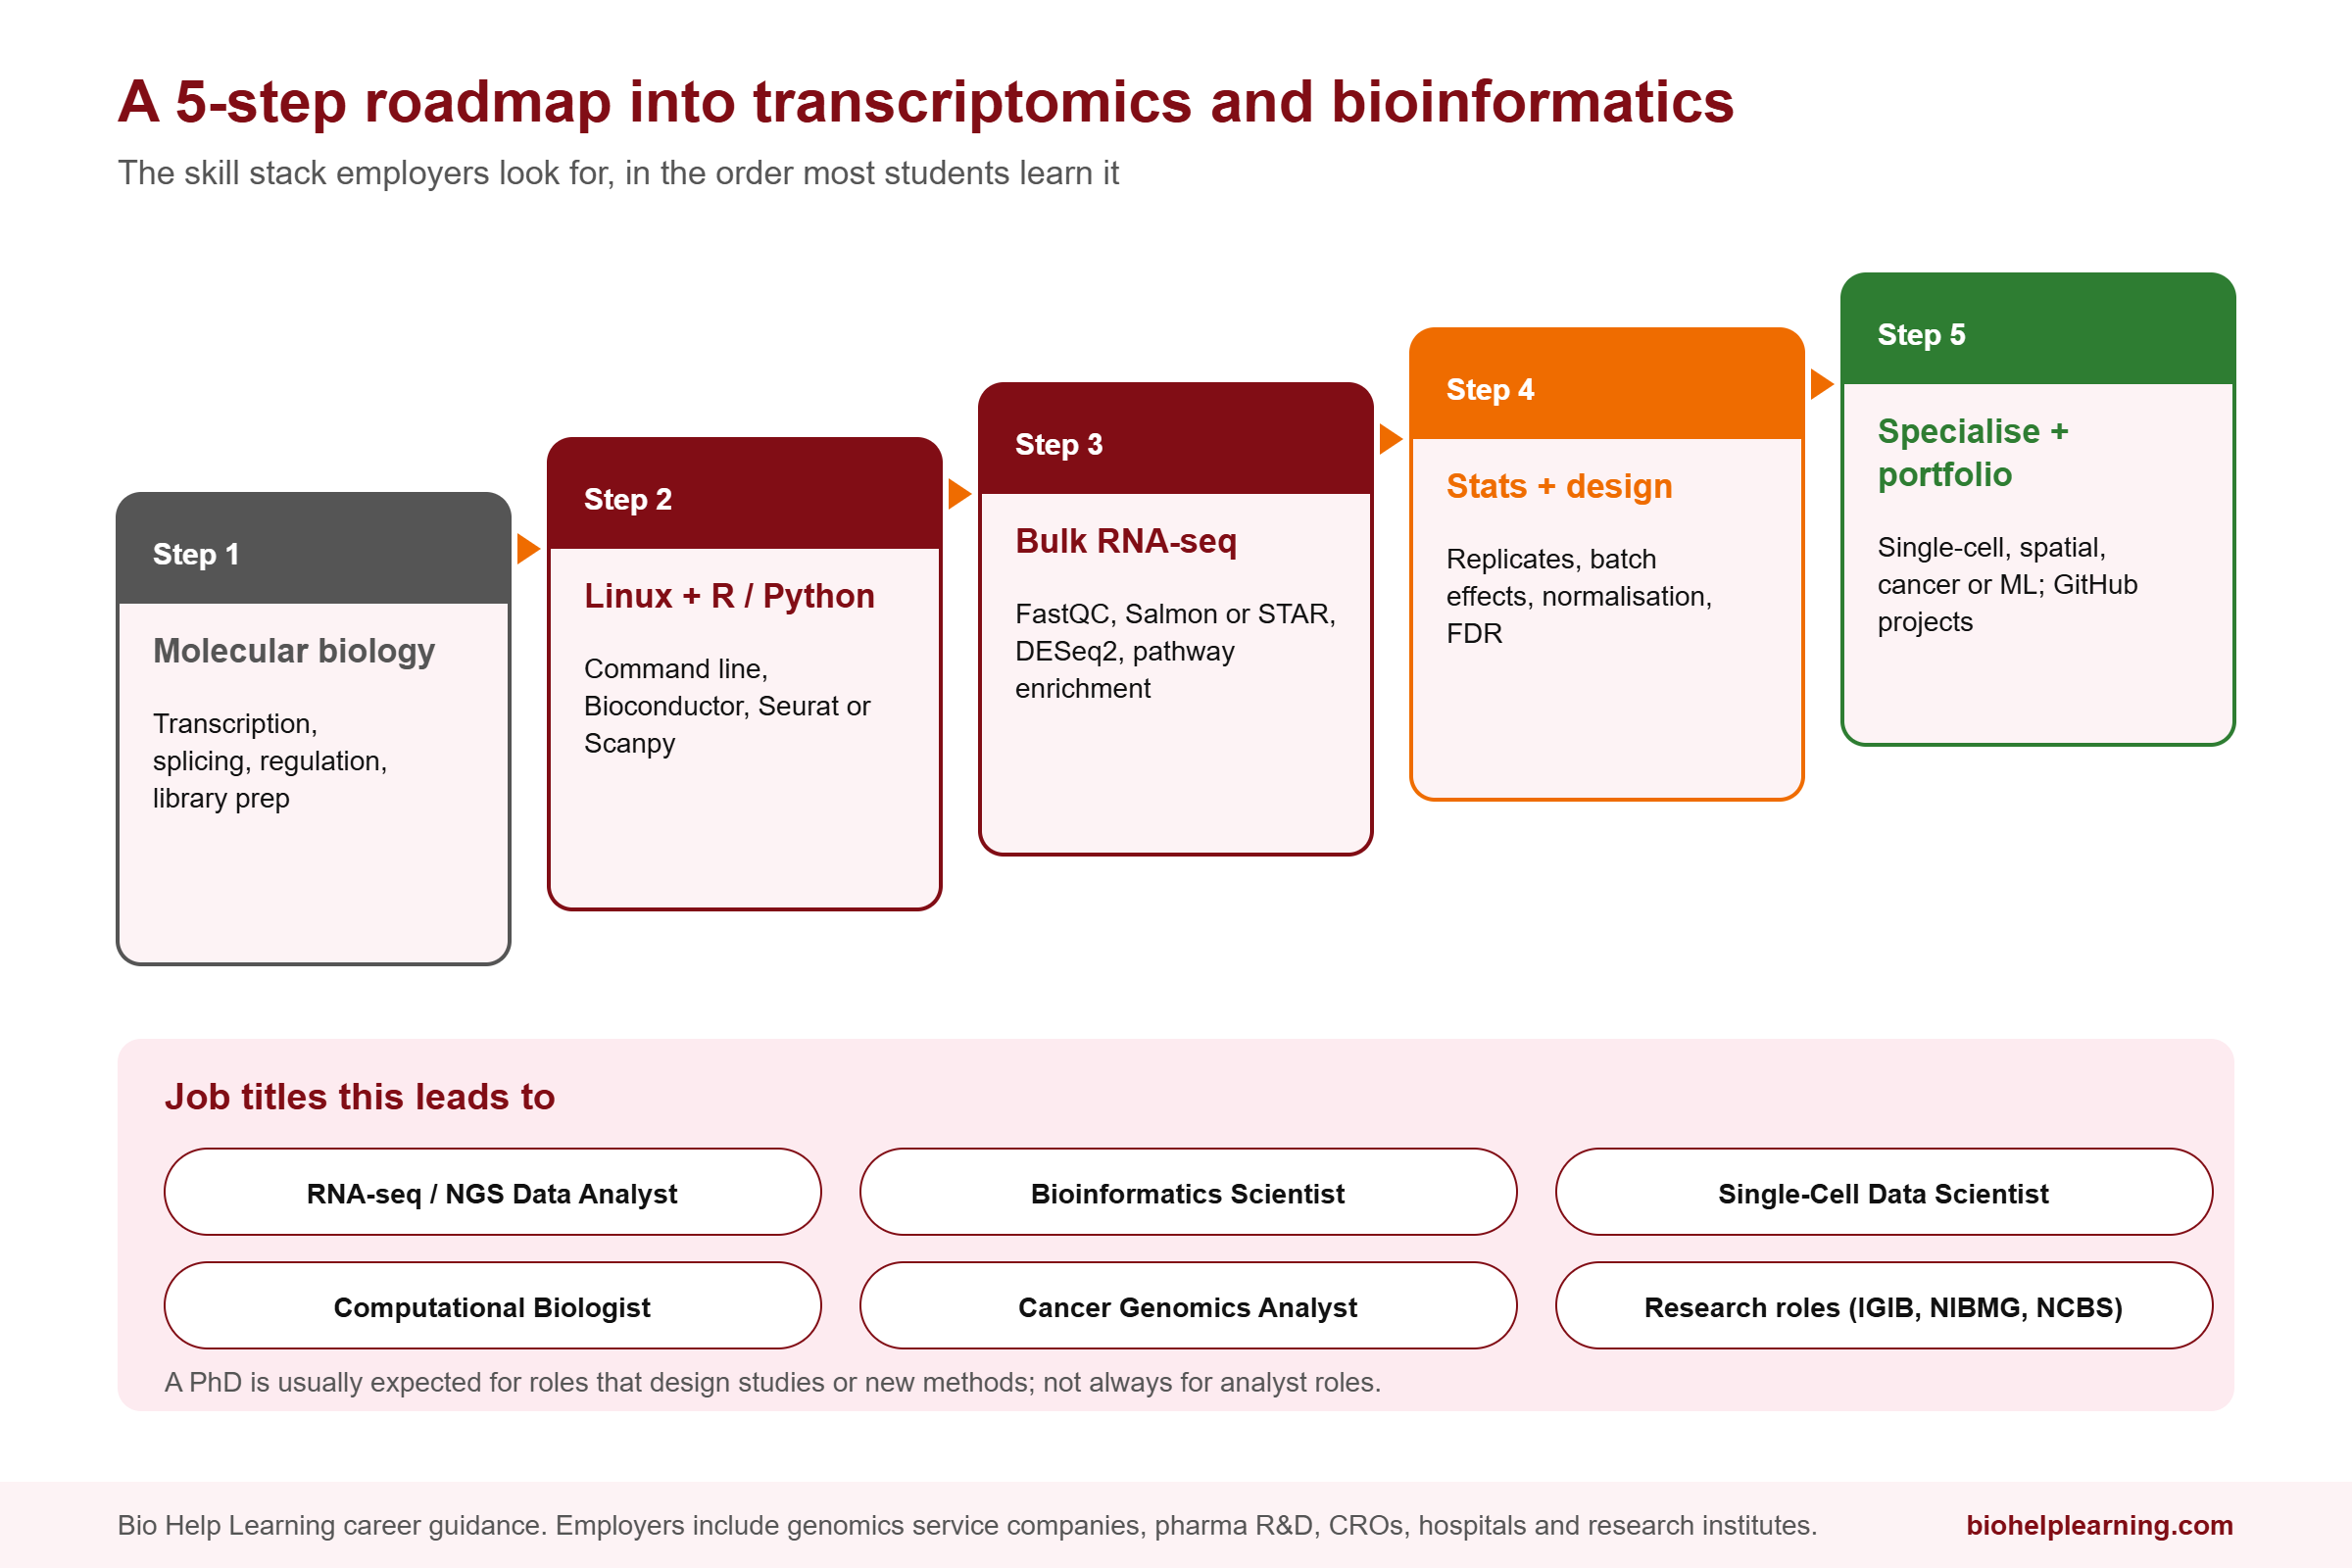
RNA-seq is now a routine experiment in biology labs, which makes RNA-seq analysis one of the most useful entry skills in bioinformatics. Here is a practical roadmap.
Step 1: Strengthen molecular biology
Transcription, splicing, gene regulation and the basics of library preparation. You need to understand what a transcript, an isoform and a read count are.
Step 2: Learn Linux and R or Python
Alignment and quantification run on the Linux command line. Differential expression is mostly done in R with Bioconductor packages, while single-cell work is split between R (Seurat) and Python (Scanpy).
Step 3: Run a complete bulk RNA-seq analysis
Download a public dataset from GEO or SRA, run quality control (see our tutorial on quality control with FastQC and MultiQC), quantify with Salmon or align with STAR, then find differentially expressed genes with DESeq2 and run pathway enrichment. Reproduce one figure from the original paper.
Step 4: Statistics and experimental design
Learn about replicates, batch effects, normalisation and multiple-testing correction. As the Duke case shows, these are not optional extras; they decide whether your result is real.
Step 5: Specialise and build a portfolio
Choose single-cell, spatial, cancer transcriptomics, long-read isoforms or machine learning on expression data. Put complete, documented projects on GitHub. Our lists of bioinformatics project ideas for students and projects using Python are good starting points.
Common job titles
- RNA-seq / NGS Data Analyst
- Bioinformatics Scientist (Transcriptomics)
- Single-Cell Data Scientist
- Computational Biologist
- Cancer Genomics Analyst
Employers include genomics service companies, pharma and biotech R&D teams, contract research organisations, hospitals running clinical genomics, and research institutes such as CSIR-IGIB, NIBMG and NCBS.
Do you need a PhD?
For analyst roles running established pipelines, a strong master’s degree and a solid portfolio are often enough. For roles that involve designing studies, building new methods or leading research, a PhD is usually expected. We discuss this in is a PhD in bioinformatics worth it in the AI era. For the wider picture, see how to become a bioinformatician and bioinformatics career scope in India.
Courses to Learn Transcriptomics in India
Free university courses (NPTEL / SWAYAM)
- Next Generation Sequencing Technologies: Data Analysis and Applications – Prof. Riddhiman Dhar, IIT Kharagpur. A 12-week course; weeks 7 to 10 cover RNA-seq processing, differential expression with multiple-testing correction, gene ontology and pathway enrichment, and a hands-on RNA-seq tutorial.
- Biological Data Analysis and Visualization with R – Prof. Riddhiman Dhar, IIT Kharagpur. Useful preparation for Bioconductor-based analysis.
- BioInformatics: Algorithms and Applications – Prof. Michael Gromiha, IIT Madras.
NPTEL runs courses in fixed semesters, so check current dates on each course page. See our roundup of free bioinformatics courses for more.
Degree routes
MSc Bioinformatics, Biotechnology or Genetics with a computational focus, followed by a PhD in a genomics or systems biology lab for research careers.
Industry-focused training
Bio Help Learning offers hands-on courses in RNA-seq data analysis, single-cell RNA-seq data analysis, and cancer genomics with TCGA and GEO data, which uses public expression datasets of exactly the kind described above.
Free self-study resources
- The Bioconductor RNA-seq workflow (rnaseqGene) and the DESeq2 vignette.
- Galaxy Training Network transcriptomics tutorials.
- The nf-core/rnaseq pipeline documentation.
- Seurat and Scanpy tutorials for single-cell analysis.
- GEO and GEO2R for exploring public expression data in the browser.
What Transcriptomics and Bioinformatics Still Cannot Do
Transcriptomics is powerful, but it has real limits.
RNA is not protein
As noted earlier, mRNA levels explain only part of the variation in protein levels, and the exact share is still debated. A gene that goes up in RNA-seq may not change at the protein level, and the protein may be modified or regulated in ways RNA cannot show. Confirming key findings at the protein level is good practice.
Small sample sizes and overfitting
Many studies compare three samples against three. With 20,000 genes and few replicates, it is easy to find patterns that do not replicate, and the Duke case showed how far an overfitted signature can travel. Independent validation is essential before any clinical use.
Batch effects
Samples processed on different days, by different people or on different machines can differ more than the biology you are studying. Good experimental design, randomisation and careful correction are needed, and no software can fully rescue a badly designed experiment.
Single-cell and spatial trade-offs
Single-cell methods capture only a fraction of each cell’s RNA and produce many zeros, and dissociating tissue can stress or lose some cell types. Spatial methods trade off resolution, gene coverage and cost, and produce datasets large enough to strain ordinary computers.
Diversity of reference data
Major reference resources do not represent the world evenly. Of the GTEx donors with both RNA-seq and genome data, 85.3% were European American, 12.3% African American and just 1.4% Asian American. Indian and other South Asian populations remain under-represented in many expression references.
Expression is a snapshot
A transcriptome captures one moment under one set of conditions. Many genes respond within minutes to stress, handling or time of day, so results always depend on how and when samples were collected.
Our article will AI replace bioinformaticians discusses why careful human judgement still matters even as tools become more automated, and AI in bioinformatics covers where machine learning is genuinely helping.
Frequently Asked Questions
What is transcriptomics in simple words?
Transcriptomics is the study of all the RNA molecules in a cell or tissue at a given time. Because genes are copied into RNA when they are switched on, the transcriptome shows which genes are active and how strongly.
What is the difference between genomics, transcriptomics and proteomics?
Genomics studies DNA, the fixed master copy. Transcriptomics studies RNA, the working copies made when genes are active. Proteomics studies proteins, the molecules built from those RNA instructions. Each layer adds information the previous one cannot provide.
How did bioinformatics change transcriptomics?
It made RNA-seq usable. Bioinformatics provided spliced aligners like STAR, fast quantifiers like Salmon and kallisto, statistical tools like DESeq2 for finding changed genes, and the clustering and integration methods that make single-cell and spatial transcriptomics possible.
Is RNA-seq better than microarrays?
For most research uses, yes. RNA-seq detects a wider range of expression levels, finds new transcripts and splice variants, and does not need probes designed in advance. Microarrays have not disappeared, though: the MINDACT trial described above takes its name from microarray testing (“Microarray In Node-negative Disease may Avoid ChemoTherapy”).
Which software is used for RNA-seq data analysis?
A common workflow uses FastQC for quality control, STAR or HISAT2 for alignment (or Salmon and kallisto for fast quantification), featureCounts or tximport to build count tables, and DESeq2, edgeR or limma-voom for differential expression. Single-cell analysis typically uses Seurat or Scanpy.
Is transcriptomics a good career option in India?
RNA-seq analysis is one of the most common entry skills in bioinformatics, and single-cell and spatial analysis are fast-growing specialisations. Employers include research institutes, genomics service companies, pharma R&D teams and clinical genomics labs.
What is single-cell RNA sequencing?
Single-cell RNA-seq measures gene expression in individual cells rather than averaging across a whole tissue. It reveals distinct cell types and states, and it underpins global projects like the Human Cell Atlas, which has profiled more than 100 million cells.
Key Takeaways
- Transcriptomics studies all the RNA in a cell or tissue, showing which genes are active at a given moment.
- The field moved from SAGE and microarrays to RNA-seq in 2008, then to single-cell (2009 onward) and spatial methods.
- Bioinformatics made each step possible: spliced alignment, fast quantification, count-based statistics and single-cell clustering.
- Expression signatures can change treatment, as MammaPrint and the MINDACT trial showed.
- The Duke case is a permanent warning: unreproducible, overfitted analyses can harm patients.
- RNA is not protein, small studies overfit, batch effects mislead, and reference data are not yet diverse enough.
References and Further Reading
- Mortazavi A. et al. Mapping and quantifying mammalian transcriptomes by RNA-Seq. Nature Methods 5, 621–628 (2008). DOI: 10.1038/nmeth.1226
- Velculescu V.E. et al. Serial analysis of gene expression. Science 270, 484–487 (1995).
- Tang F. et al. mRNA-Seq whole-transcriptome analysis of a single cell. Nature Methods 6, 377–382 (2009).
- Love M.I., Huber W., Anders S. Moderated estimation of fold change and dispersion for RNA-seq data with DESeq2. Genome Biology 15, 550 (2014). DOI: 10.1186/s13059-014-0550-8
- Dobin A. et al. STAR: ultrafast universal RNA-seq aligner. Bioinformatics 29, 15–21 (2013). DOI: 10.1093/bioinformatics/bts635
- Bray N.L. et al. Near-optimal probabilistic RNA-seq quantification. Nature Biotechnology 34, 525–527 (2016). DOI: 10.1038/nbt.3519
- Patro R. et al. Salmon provides fast and bias-aware quantification of transcript expression. Nature Methods (2017). nature.com
- GEO: archive for gene expression and epigenomics data sets: 23-year update. Nucleic Acids Res 52(D1), D138–D144 (2024). DOI: 10.1093/nar/gkad965
- The GTEx Consortium atlas of genetic regulatory effects across human tissues (v8). bioRxiv DOI: 10.1101/787903
- Cardoso F. et al. 70-gene signature as an aid to treatment decisions in early-stage breast cancer. N Engl J Med 375, 717–729 (2016).
- Baggerly K.A., Coombes K.R. Deriving chemosensitivity from cell lines: forensic bioinformatics and reproducible research in high-throughput biology. Ann Appl Stat 3, 1309–1335 (2009).
- Nature News. Institute of Medicine report on the Duke case (2012). nature.com
- Vogel C., Marcotte E.M. Insights into the regulation of protein abundance from proteomic and transcriptomic analyses. Nat Rev Genet 13, 227–232 (2012). DOI: 10.1038/nrg3185
- Marx V. Method of the Year: spatially resolved transcriptomics. Nature Methods 18, 9–14 (2021). DOI: 10.1038/s41592-020-01033-y
- NPTEL. Next Generation Sequencing Technologies: Data Analysis and Applications (IIT Kharagpur). onlinecourses.nptel.ac.in